
Changelog
Discover the latest features in the Aptible product.
Discover the latest features in the Aptible product.
Jul 18, 2025
Load Balancing Algorithms can now be configured through the UI, with options in the CLI and Terraform coming soon. When creating and editing HTTP(s) endpoints in the UI, you’ll see a new field, Load Balancing Algorithm that allows you to choose between Round Robin (the current default), Least Outstanding Requests, and Weighted Random for request routing.

Load Balancing Algorithms can now be configured through the UI, with options in the CLI and Terraform coming soon. When creating and editing HTTP(s) endpoints in the UI, you’ll see a new field, Load Balancing Algorithm that allows you to choose between Round Robin (the current default), Least Outstanding Requests, and Weighted Random for request routing.
Jul 18, 2025
Jul 18, 2025
Load Balancing Algorithms can now be configured through the UI, with options in the CLI and Terraform coming soon. When creating and editing HTTP(s) endpoints in the UI, you’ll see a new field, Load Balancing Algorithm that allows you to choose between Round Robin (the current default), Least Outstanding Requests, and Weighted Random for request routing.
Load Balancing Algorithms can now be configured through the UI, with options in the CLI and Terraform coming soon. When creating and editing HTTP(s) endpoints in the UI, you’ll see a new field, Load Balancing Algorithm that allows you to choose between Round Robin (the current default), Least Outstanding Requests, and Weighted Random for request routing.
Jul 18, 2025
Jun 23, 2025
Scale operations within horizontal autoscaling enabled can be configured to add or remove only the appropriate number of containers to reach the desired running count without restarting all the other running containers in the service.
If you are using horizontal autoscaling on a background worker or job processing type service, you may want to configure it to use the restart-free variant in order to minimize interruptions of jobs in process.
The restart-free scale type may also be helpful if you are using horizontal autoscaling on a web application that can experience sudden traffic spikes, since the restart-free scaling will allow capacity to be added without interrupting all current connections. Additionally, web applications that experience strain on backend resources due to zero-downtime deployments can leverage the restart-free scaling so that horizontal autoscaling does not overwhelm those connected resources.
See the docs on Horizontal Autoscaling here and our updated guide for getting started with Horizontal Autoscaling.
Jun 23, 2025
Jun 23, 2025
Scale operations within horizontal autoscaling enabled can be configured to add or remove only the appropriate number of containers to reach the desired running count without restarting all the other running containers in the service.
If you are using horizontal autoscaling on a background worker or job processing type service, you may want to configure it to use the restart-free variant in order to minimize interruptions of jobs in process.
The restart-free scale type may also be helpful if you are using horizontal autoscaling on a web application that can experience sudden traffic spikes, since the restart-free scaling will allow capacity to be added without interrupting all current connections. Additionally, web applications that experience strain on backend resources due to zero-downtime deployments can leverage the restart-free scaling so that horizontal autoscaling does not overwhelm those connected resources.
See the docs on Horizontal Autoscaling here and our updated guide for getting started with Horizontal Autoscaling.
Jun 23, 2025
May 16, 2025
New Default Region for Canadian Cross-Region Copy Backups:
ca-west-1(Canada West) is now the default region for cross-region copy backups initiated fromca-central-1.New "Stop Timeout" Setting for App Services: "Stop Timeout" can now be configured on a per-service basis, controlling how long service containers are allowed to continue working after the initial SIGTERM, before the hard shutdown. This setting can be configured through the UI, CLI, or Terraform. See the docs here for more information.
May 16, 2025
May 16, 2025
New Default Region for Canadian Cross-Region Copy Backups:
ca-west-1(Canada West) is now the default region for cross-region copy backups initiated fromca-central-1.New "Stop Timeout" Setting for App Services: "Stop Timeout" can now be configured on a per-service basis, controlling how long service containers are allowed to continue working after the initial SIGTERM, before the hard shutdown. This setting can be configured through the UI, CLI, or Terraform. See the docs here for more information.
May 16, 2025
May 1, 2025
This month, the Aptible team focused on addressing a number of enhancements and bugs reported by our customers while we wrap up some new features (check out our roadmap for more info):
UI:
The Stacks and Environments UI pages now show "Total estimated monthly costs"
A Datadog site can now be selected for metric drains via the UI
Container ports for TCP and TLS endpoints can be updated via the UI
SCIM Improvements:
Enhanced SCIM compatibility with Microsoft Entra and Ping Identity
Improved error response messages for better feedback to Identity Providers
May 1, 2025
May 1, 2025
This month, the Aptible team focused on addressing a number of enhancements and bugs reported by our customers while we wrap up some new features (check out our roadmap for more info):
UI:
The Stacks and Environments UI pages now show "Total estimated monthly costs"
A Datadog site can now be selected for metric drains via the UI
Container ports for TCP and TLS endpoints can be updated via the UI
SCIM Improvements:
Enhanced SCIM compatibility with Microsoft Entra and Ping Identity
Improved error response messages for better feedback to Identity Providers
May 1, 2025
Mar 28, 2025
This month, the Aptible team focused on addressing a number of enhancements and bugs reported by our customers:
Operation Logs:
Better differentiate the output of container logs from platform logs in operations. For example, the output of your migrations during
before_deploysteps, or the output from your container if it is not passing release health checks
Terraform Provider:
Destroying an Environment now will properly handle (deprovision) any log drain created by Aptible for the purposes of stream logs via the CLI with
aptible logsWhen endpoints, databases, or replicas are created but fail to provision, they are now kept in Terraform state so that attempting to re-apply will replace them (destroy and create a replacement), preventing users from having to clean up outside of Terraform.
CLI:
Fixed log streaming for Backup restores when restored to a different stack than the original database.
Added additional metadata about the Stack in the JSON output of
environment:listAdded additional metadata about the container profile in JSON output of
db:list
Deploy to Aptible Github Action:
Updated CLI version
UI:
The Stack overview page now has the ability to sort columns (i.e. sort by costs)
Mar 28, 2025
Mar 28, 2025
This month, the Aptible team focused on addressing a number of enhancements and bugs reported by our customers:
Operation Logs:
Better differentiate the output of container logs from platform logs in operations. For example, the output of your migrations during
before_deploysteps, or the output from your container if it is not passing release health checks
Terraform Provider:
Destroying an Environment now will properly handle (deprovision) any log drain created by Aptible for the purposes of stream logs via the CLI with
aptible logsWhen endpoints, databases, or replicas are created but fail to provision, they are now kept in Terraform state so that attempting to re-apply will replace them (destroy and create a replacement), preventing users from having to clean up outside of Terraform.
CLI:
Fixed log streaming for Backup restores when restored to a different stack than the original database.
Added additional metadata about the Stack in the JSON output of
environment:listAdded additional metadata about the container profile in JSON output of
db:list
Deploy to Aptible Github Action:
Updated CLI version
UI:
The Stack overview page now has the ability to sort columns (i.e. sort by costs)
Mar 28, 2025
Feb 20, 2025
We are excited to announce the release of MySQL 8.4 on Aptible, the first Long-Term Support (LTS) release of MySQL. As an LTS version, MySQL 8.4 releases will focus on necessary fixes, minimizing the risk of breaking changes between updates. You can read about the changes introduced in MySQL 8.4’s What Is New and about the reasoning behind MySQL’s new versioning model in their blog post.
If you want to upgrade or have questions about MySQL 8.4, please contact Aptible Support.
Feb 20, 2025
Feb 20, 2025
We are excited to announce the release of MySQL 8.4 on Aptible, the first Long-Term Support (LTS) release of MySQL. As an LTS version, MySQL 8.4 releases will focus on necessary fixes, minimizing the risk of breaking changes between updates. You can read about the changes introduced in MySQL 8.4’s What Is New and about the reasoning behind MySQL’s new versioning model in their blog post.
If you want to upgrade or have questions about MySQL 8.4, please contact Aptible Support.
Feb 20, 2025
Feb 11, 2025
CLI Updates:
In an effort to improve the CLI and better understand how customers are using it we have added telemetry to our commands. This telemetry data is being sent to an internal system that we are already using throughout our platform, but users might see an extra request being sent to
tuna.aptible.comwhen a command is being run.We have significantly improved performance of our commands that list resources (e.g.
environment:list,apps,db:list,endpoints:list,log_drain:list, andmetric_drain:list)
Install the latest version of the CLI here.
Other releases improvements:
Autoscaling Update: The
Post Release Cooldownscaling policy configuration will now always ignore this period of time following a release in the metrics used to evaluate scaling, even if it would be included in the current lookback. You can now use this setting to ignore spiky CPU/memory usage on service startup without having to tune your lookback. The default has also been lowered from 5 minutes to 1 minute. Note: This setting is available on both Horizontal and Vertical Autoscaling.
Feb 11, 2025
Feb 11, 2025
CLI Updates:
In an effort to improve the CLI and better understand how customers are using it we have added telemetry to our commands. This telemetry data is being sent to an internal system that we are already using throughout our platform, but users might see an extra request being sent to
tuna.aptible.comwhen a command is being run.We have significantly improved performance of our commands that list resources (e.g.
environment:list,apps,db:list,endpoints:list,log_drain:list, andmetric_drain:list)
Install the latest version of the CLI here.
Other releases improvements:
Autoscaling Update: The
Post Release Cooldownscaling policy configuration will now always ignore this period of time following a release in the metrics used to evaluate scaling, even if it would be included in the current lookback. You can now use this setting to ignore spiky CPU/memory usage on service startup without having to tune your lookback. The default has also been lowered from 5 minutes to 1 minute. Note: This setting is available on both Horizontal and Vertical Autoscaling.
Feb 11, 2025
Jan 16, 2025
Databases (including Replicas) can now be excluded from future automatic backups via Terraform. Previously, this setting was only available in the Aptible Dashboard.
To exclude a database from the backup retention policy, therefore preventing new automatic backups from being created, use the backup_retention_policy block and set enable_backups to false.
Jan 16, 2025
Jan 16, 2025
Databases (including Replicas) can now be excluded from future automatic backups via Terraform. Previously, this setting was only available in the Aptible Dashboard.
To exclude a database from the backup retention policy, therefore preventing new automatic backups from being created, use the backup_retention_policy block and set enable_backups to false.
Jan 16, 2025
Jan 10, 2025
CLI Updates:
--envoption: All commands now accept--envas an alias for--environment.Update Container Profile using
app:scale: Theaptible app:scalecommand now allows you to update the container profile without changing the container size or number of containers.Container Profile included in
aptible services: Theaptible servicescommand now includes the container profile, in addition to container size and count.Default Behavior for
backupcommands: Thebackup:listnow lists all backups instead of defaulting to a one-month lookback. Thebackup:orphanedcommand also lists all orphaned backups instead of defaulting to a one-year lookback.
New version of CLI available here for download.
Other recent enhancements/releases:
PostgreSQL 12 + RabbitMQ 3.12 are now marked EOL
Added operation log URLs across multiple locations—including operation headers, disconnection messages, and operation logs themselves—ensuring users can easily locate logs in the UI even if your client crashes, connection fails mid-operation, or you want to quickly share the logs without copy/pasting hundreds of lines
Jan 10, 2025
Jan 10, 2025
CLI Updates:
--envoption: All commands now accept--envas an alias for--environment.Update Container Profile using
app:scale: Theaptible app:scalecommand now allows you to update the container profile without changing the container size or number of containers.Container Profile included in
aptible services: Theaptible servicescommand now includes the container profile, in addition to container size and count.Default Behavior for
backupcommands: Thebackup:listnow lists all backups instead of defaulting to a one-month lookback. Thebackup:orphanedcommand also lists all orphaned backups instead of defaulting to a one-year lookback.
New version of CLI available here for download.
Other recent enhancements/releases:
PostgreSQL 12 + RabbitMQ 3.12 are now marked EOL
Added operation log URLs across multiple locations—including operation headers, disconnection messages, and operation logs themselves—ensuring users can easily locate logs in the UI even if your client crashes, connection fails mid-operation, or you want to quickly share the logs without copy/pasting hundreds of lines
Jan 10, 2025
Dec 19, 2024

Horizontal Autoscaling (HAS) for App Services is now generally available, expanding our autoscaling functionality alongside Vertical Autoscaling for App Services (available on the Enterprise plan).
When this feature is enabled, the number of containers for a given App Service will be automatically scaled based on CPU usage. This ensures cost efficiency and performance—without the need for manual scaling, saving engineering time while improving app reliability.
This feature is available on Dedicated Stacks on the Production and Enterprise plans. Note: you can upgrade or modify your plan anytime directly in the "Plans" page in the Dashboard.
See Horizontal Autoscaling docs here including our guide for configuring Horizontal Autoscaling here.
Dec 19, 2024
Dec 19, 2024
Horizontal Autoscaling (HAS) for App Services is now generally available, expanding our autoscaling functionality alongside Vertical Autoscaling for App Services (available on the Enterprise plan).
When this feature is enabled, the number of containers for a given App Service will be automatically scaled based on CPU usage. This ensures cost efficiency and performance—without the need for manual scaling, saving engineering time while improving app reliability.
This feature is available on Dedicated Stacks on the Production and Enterprise plans. Note: you can upgrade or modify your plan anytime directly in the "Plans" page in the Dashboard.
See Horizontal Autoscaling docs here including our guide for configuring Horizontal Autoscaling here.
Dec 19, 2024
Dec 12, 2024
Activity Filters

Activity can now be filtered by Resource Type, Operation Type, and Operation Status, making it easier to find operations quickly!
Other recent improvements/releases:
Cost estimates in UI now reflect custom pricing rates
"Ask Chatbot" option when submitting a support ticket
Activity Filters
Activity can now be filtered by Resource Type, Operation Type, and Operation Status, making it easier to find operations quickly!
Other recent improvements/releases:
Cost estimates in UI now reflect custom pricing rates
"Ask Chatbot" option when submitting a support ticket
Dec 12, 2024
Dec 12, 2024
Activity Filters
Activity can now be filtered by Resource Type, Operation Type, and Operation Status, making it easier to find operations quickly!
Other recent improvements/releases:
Cost estimates in UI now reflect custom pricing rates
"Ask Chatbot" option when submitting a support ticket
Activity Filters
Activity can now be filtered by Resource Type, Operation Type, and Operation Status, making it easier to find operations quickly!
Other recent improvements/releases:
Cost estimates in UI now reflect custom pricing rates
"Ask Chatbot" option when submitting a support ticket
Dec 12, 2024
Nov 19, 2024
We’re happy to announce that RabbitMQ 3.13 and 4.0 databases are now available on Aptible. If you’re interested in upgrading an existing RabbitMQ database, please reach out to Aptible Support for help.
We’re happy to announce that RabbitMQ 3.13 and 4.0 databases are now available on Aptible. If you’re interested in upgrading an existing RabbitMQ database, please reach out to Aptible Support for help.
Nov 19, 2024
Nov 19, 2024
We’re happy to announce that RabbitMQ 3.13 and 4.0 databases are now available on Aptible. If you’re interested in upgrading an existing RabbitMQ database, please reach out to Aptible Support for help.
We’re happy to announce that RabbitMQ 3.13 and 4.0 databases are now available on Aptible. If you’re interested in upgrading an existing RabbitMQ database, please reach out to Aptible Support for help.
Nov 19, 2024
Nov 15, 2024

We are excited to announce that SCIM (System for Cross-domain Identity Management) is now available on the Production and Enterprise plans.
SCIM facilitates automated user provisioning and deprovisioning and extends to group provisioning and linking to existing groups, significantly reducing the manual effort involved in user and group management while minimizing potential security risks. This enhancement equips our customers with robust user and group management capabilities, enhancing security and streamlining operations throughout their teams.
To start using this feature, see our SCIM Implementation Guide.
Nov 15, 2024
Nov 15, 2024
We are excited to announce that SCIM (System for Cross-domain Identity Management) is now available on the Production and Enterprise plans.
SCIM facilitates automated user provisioning and deprovisioning and extends to group provisioning and linking to existing groups, significantly reducing the manual effort involved in user and group management while minimizing potential security risks. This enhancement equips our customers with robust user and group management capabilities, enhancing security and streamlining operations throughout their teams.
To start using this feature, see our SCIM Implementation Guide.
Nov 15, 2024
Nov 8, 2024

Container right-sizing recommendations are now shown in the Aptible Dashboard for App Services and Databases.
For each resource, one of the following scaling recommendations will show:
Rightsized, indicating optimal performance and cost efficiency
Scale Up, recommending increased resources to meet growing demand
Scale Down, recommending a reduction to avoid overspending
Recommendations are updated daily based on the last two weeks of data, and provide vertical scaling recommendations for optimal container size and profile. Use the auto-fill button to apply recommended changes with a single click!
To begin using this feature, navigate to the App Services or Database page in the Aptible Dashboard.
Nov 8, 2024
Nov 8, 2024
Container right-sizing recommendations are now shown in the Aptible Dashboard for App Services and Databases.
For each resource, one of the following scaling recommendations will show:
Rightsized, indicating optimal performance and cost efficiency
Scale Up, recommending increased resources to meet growing demand
Scale Down, recommending a reduction to avoid overspending
Recommendations are updated daily based on the last two weeks of data, and provide vertical scaling recommendations for optimal container size and profile. Use the auto-fill button to apply recommended changes with a single click!
To begin using this feature, navigate to the App Services or Database page in the Aptible Dashboard.
Nov 8, 2024
Nov 5, 2024
TLSv1.3 is now available for HTTPS and Legacy ELB Endpoints, bringing additional security to your Apps. You can enable TLSv1.3 by configuring SSL_PROTOCOLS_OVERRIDE according to our documentation.
TLSv1.3 is now available for HTTPS and Legacy ELB Endpoints, bringing additional security to your Apps. You can enable TLSv1.3 by configuring SSL_PROTOCOLS_OVERRIDE according to our documentation.
Nov 5, 2024
Nov 5, 2024
TLSv1.3 is now available for HTTPS and Legacy ELB Endpoints, bringing additional security to your Apps. You can enable TLSv1.3 by configuring SSL_PROTOCOLS_OVERRIDE according to our documentation.
TLSv1.3 is now available for HTTPS and Legacy ELB Endpoints, bringing additional security to your Apps. You can enable TLSv1.3 by configuring SSL_PROTOCOLS_OVERRIDE according to our documentation.
Nov 5, 2024
Oct 22, 2024
We are happy to announce that PostgreSQL 17 is now available on Aptible. PostgreSQL 17 introduces several updates, such as new JSON-related features and performance improvements across multiple key processes like vacuum and WAL processing. You can learn more in PostgreSQL’s official release post.
We are happy to announce that PostgreSQL 17 is now available on Aptible. PostgreSQL 17 introduces several updates, such as new JSON-related features and performance improvements across multiple key processes like vacuum and WAL processing. You can learn more in PostgreSQL’s official release post.
Oct 22, 2024
Oct 22, 2024
We are happy to announce that PostgreSQL 17 is now available on Aptible. PostgreSQL 17 introduces several updates, such as new JSON-related features and performance improvements across multiple key processes like vacuum and WAL processing. You can learn more in PostgreSQL’s official release post.
We are happy to announce that PostgreSQL 17 is now available on Aptible. PostgreSQL 17 introduces several updates, such as new JSON-related features and performance improvements across multiple key processes like vacuum and WAL processing. You can learn more in PostgreSQL’s official release post.
Oct 22, 2024
Oct 21, 2024
As of earlier this month, we began migrating customers to our new billing system, introducing several enhancements designed to improve visibility and simplify tracking costs.
Accumulated Usage: You can now see your usage as it accumulates throughout the month. The Draft Invoice displays your usage so far, and you can drill down further to view detailed usage by day and line item.

Projected Monthly Costs: We’ve relocated projected invoice information to the Stack and Environment pages, where it’s now labeled as “Estimated Monthly Costs.” This change aims to provide more contextual insight where it matters most.
Invoice History: The Invoice History page will show your current and future invoices on the new billing system. For access to historical invoices, simply click the link at the top of the billing portal.
PDF Invoice Downloads: You can now download invoices directly to PDF from the UI, making it easier to share and archive your billing records.
Improved Speed: Invoices now load significantly faster!
For more details, visit the billing dashboard or reach out to our support team if you have any questions.
As of earlier this month, we began migrating customers to our new billing system, introducing several enhancements designed to improve visibility and simplify tracking costs.
Accumulated Usage: You can now see your usage as it accumulates throughout the month. The Draft Invoice displays your usage so far, and you can drill down further to view detailed usage by day and line item.
Projected Monthly Costs: We’ve relocated projected invoice information to the Stack and Environment pages, where it’s now labeled as “Estimated Monthly Costs.” This change aims to provide more contextual insight where it matters most.
Invoice History: The Invoice History page will show your current and future invoices on the new billing system. For access to historical invoices, simply click the link at the top of the billing portal.
PDF Invoice Downloads: You can now download invoices directly to PDF from the UI, making it easier to share and archive your billing records.
Improved Speed: Invoices now load significantly faster!
For more details, visit the billing dashboard or reach out to our support team if you have any questions.
Oct 21, 2024
Oct 21, 2024
As of earlier this month, we began migrating customers to our new billing system, introducing several enhancements designed to improve visibility and simplify tracking costs.
Accumulated Usage: You can now see your usage as it accumulates throughout the month. The Draft Invoice displays your usage so far, and you can drill down further to view detailed usage by day and line item.
Projected Monthly Costs: We’ve relocated projected invoice information to the Stack and Environment pages, where it’s now labeled as “Estimated Monthly Costs.” This change aims to provide more contextual insight where it matters most.
Invoice History: The Invoice History page will show your current and future invoices on the new billing system. For access to historical invoices, simply click the link at the top of the billing portal.
PDF Invoice Downloads: You can now download invoices directly to PDF from the UI, making it easier to share and archive your billing records.
Improved Speed: Invoices now load significantly faster!
For more details, visit the billing dashboard or reach out to our support team if you have any questions.
Oct 21, 2024
Oct 18, 2024
We’re excited to announce that we’ve streamlined our plans to better meet the needs of organizations at different stages of growth. Our plans have been simplified from Starter, Growth, Scale, and Enterprise to just three tiers: Development, Production, and Enterprise.
One key difference with these new plans is that we've removed scaling limits. Initially, we introduced limits to help customers keep costs under control as they grew. However, we’ve learned that these restrictions were often more of a hindrance than a help. In response, we’ve eliminated these limits, allowing you to scale without boundaries. Instead, we’ve focused on giving you greater visibility into costs so you can manage your infrastructure spending effectively as you grow.
If you’re currently on the Starter, Growth, or Scale plans—your plan will remain as is, and no action is required. However, if you'd like to explore the new Development or Production plans, you can upgrade at any time. For more details and to review specifics, visit our pricing page.
Oct 18, 2024
Oct 18, 2024
We’re excited to announce that we’ve streamlined our plans to better meet the needs of organizations at different stages of growth. Our plans have been simplified from Starter, Growth, Scale, and Enterprise to just three tiers: Development, Production, and Enterprise.
One key difference with these new plans is that we've removed scaling limits. Initially, we introduced limits to help customers keep costs under control as they grew. However, we’ve learned that these restrictions were often more of a hindrance than a help. In response, we’ve eliminated these limits, allowing you to scale without boundaries. Instead, we’ve focused on giving you greater visibility into costs so you can manage your infrastructure spending effectively as you grow.
If you’re currently on the Starter, Growth, or Scale plans—your plan will remain as is, and no action is required. However, if you'd like to explore the new Development or Production plans, you can upgrade at any time. For more details and to review specifics, visit our pricing page.
Oct 18, 2024
Oct 18, 2024
Vertical Autoscaling is now generally available on the Enterprise plan!

Keep your apps right-sized effortlessly with Vertical Autoscaling, which automatically adjusts container profiles based on real-time CPU and RAM usage. Learn more in our docs.
Vertical Autoscaling is now generally available on the Enterprise plan!
Keep your apps right-sized effortlessly with Vertical Autoscaling, which automatically adjusts container profiles based on real-time CPU and RAM usage. Learn more in our docs.
Oct 18, 2024
Oct 18, 2024
Vertical Autoscaling is now generally available on the Enterprise plan!
Keep your apps right-sized effortlessly with Vertical Autoscaling, which automatically adjusts container profiles based on real-time CPU and RAM usage. Learn more in our docs.
Vertical Autoscaling is now generally available on the Enterprise plan!
Keep your apps right-sized effortlessly with Vertical Autoscaling, which automatically adjusts container profiles based on real-time CPU and RAM usage. Learn more in our docs.
Oct 18, 2024
Oct 15, 2024
You can now add gRPC endpoints to your gRPC apps, which enable zero-downtime deploys.
For more information please check the documentation
You can now add gRPC endpoints to your gRPC apps, which enable zero-downtime deploys.
For more information please check the documentation
Oct 15, 2024
Oct 15, 2024
You can now add gRPC endpoints to your gRPC apps, which enable zero-downtime deploys.
For more information please check the documentation
You can now add gRPC endpoints to your gRPC apps, which enable zero-downtime deploys.
For more information please check the documentation
Oct 15, 2024
Oct 15, 2024
You can now force a zero-downtime deployment strategy for services without endpoints that leverages either a simple uptime healthcheck or Docker's healtcheck mechanism to ensure your services stay up during deployments.
For more information please check the documentation
You can now force a zero-downtime deployment strategy for services without endpoints that leverages either a simple uptime healthcheck or Docker's healtcheck mechanism to ensure your services stay up during deployments.
For more information please check the documentation
Oct 15, 2024
Oct 15, 2024
You can now force a zero-downtime deployment strategy for services without endpoints that leverages either a simple uptime healthcheck or Docker's healtcheck mechanism to ensure your services stay up during deployments.
For more information please check the documentation
You can now force a zero-downtime deployment strategy for services without endpoints that leverages either a simple uptime healthcheck or Docker's healtcheck mechanism to ensure your services stay up during deployments.
For more information please check the documentation
Oct 15, 2024
Sep 26, 2024
We’re happy to announce that InfluxDB 2.7 is now available on Aptible. InfluxDB 2.X introduces many new tools to visualize and process your data alongside Flux, InfluxData’s data scripting language. You can read about these changes and more in InfluxDB’s release blog post. If you are interested in upgrading an existing InfluxDB database, please contact the Aptible support team for assistance.
Additionally, for those who prefer SQL-like queries over Flux, we have no plans to deprecate InfluxDB 1.8 at this time. We intend to continue making the older version available as a part of our managed database offering until InfluxDB 3.0 OSS is released or any security concerns arise.
Sep 26, 2024
Sep 26, 2024
We’re happy to announce that InfluxDB 2.7 is now available on Aptible. InfluxDB 2.X introduces many new tools to visualize and process your data alongside Flux, InfluxData’s data scripting language. You can read about these changes and more in InfluxDB’s release blog post. If you are interested in upgrading an existing InfluxDB database, please contact the Aptible support team for assistance.
Additionally, for those who prefer SQL-like queries over Flux, we have no plans to deprecate InfluxDB 1.8 at this time. We intend to continue making the older version available as a part of our managed database offering until InfluxDB 3.0 OSS is released or any security concerns arise.
Sep 26, 2024
Aug 13, 2024
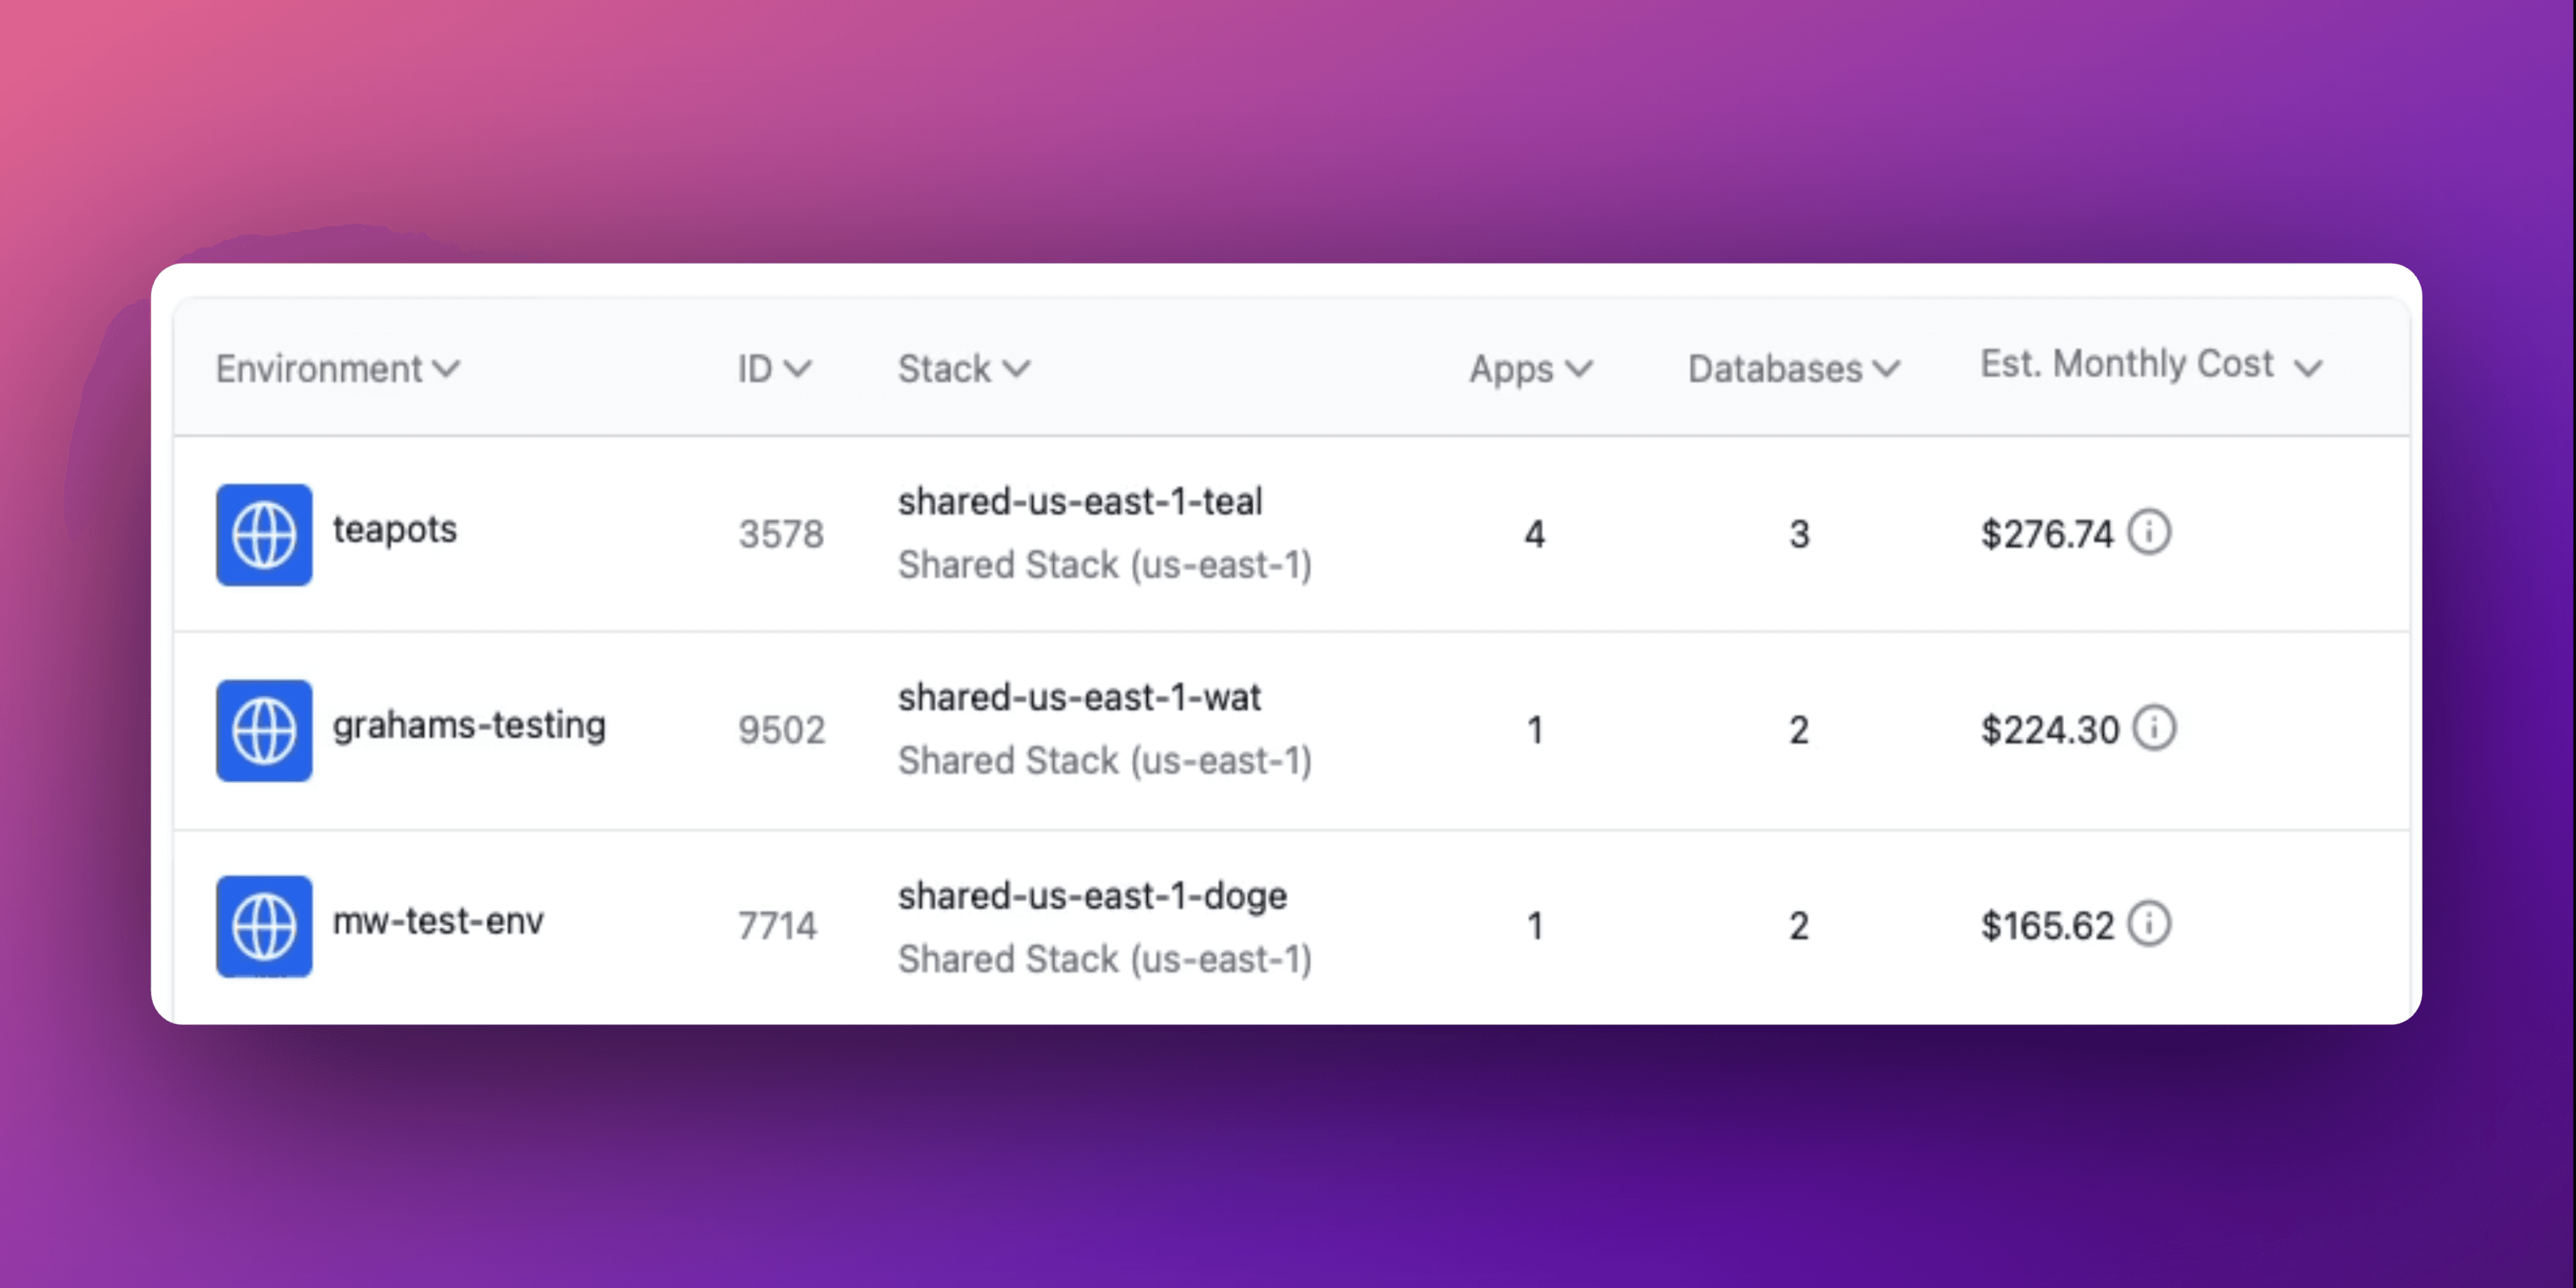
Estimated monthly costs are now shown for environments and stacks in the Aptible Dashboard! The estimates reflect the cost of running the current resources for one month. It is updated automatically as resources are added or scaled to reflect the new estimated monthly cost. Please note: it does not represent your actual usage for the month (ongoing scaling operations or deprovisioned resources are not reflected).
Estimated monthly costs are now shown for environments and stacks in the Aptible Dashboard! The estimates reflect the cost of running the current resources for one month. It is updated automatically as resources are added or scaled to reflect the new estimated monthly cost. Please note: it does not represent your actual usage for the month (ongoing scaling operations or deprovisioned resources are not reflected).
Aug 13, 2024
Aug 13, 2024
Estimated monthly costs are now shown for environments and stacks in the Aptible Dashboard! The estimates reflect the cost of running the current resources for one month. It is updated automatically as resources are added or scaled to reflect the new estimated monthly cost. Please note: it does not represent your actual usage for the month (ongoing scaling operations or deprovisioned resources are not reflected).
Estimated monthly costs are now shown for environments and stacks in the Aptible Dashboard! The estimates reflect the cost of running the current resources for one month. It is updated automatically as resources are added or scaled to reflect the new estimated monthly cost. Please note: it does not represent your actual usage for the month (ongoing scaling operations or deprovisioned resources are not reflected).
Aug 13, 2024
Aug 9, 2024
As an expansion to before_release, add the following hooks within your .aptible.yml to set up better automation around app lifecycle events on Aptible:
before_deploy(renamed frombefore_release.before_releaseis now deprecated, but will continue to work)after_deploy_successafter_restart_successafter_configure_successafter_scale_successafter_deploy_failureafter_restart_failureafter_configure_failureafter_scale_failure
Aug 9, 2024
Aug 9, 2024
As an expansion to before_release, add the following hooks within your .aptible.yml to set up better automation around app lifecycle events on Aptible:
before_deploy(renamed frombefore_release.before_releaseis now deprecated, but will continue to work)after_deploy_successafter_restart_successafter_configure_successafter_scale_successafter_deploy_failureafter_restart_failureafter_configure_failureafter_scale_failure
Aug 9, 2024
Aug 5, 2024
We released a set of changes to our clients (UI, CLI, and Terraform) to make it easier for users to provision Apps and Databases with the desired scaling options. Previously, this had to be accomplished in two steps. For example, previously in the CLI, if a user was creating a PostgreSQL Database using our RAM Optimized container profile and 4000 IOPS, they would have to:
Create the database
aptible db:create(which defaults to our General Purpose container profile and3000IOPS)Then use the web UI to immediately scale the resource
As you can read, this is a disjointed user experience and we are happy to announce that we have feature parity across all of our clients.
Aptible CLI
Users can now provide scaling options (container profile, container count, container size, disk size, or IOPS) upon creation of an App or Database via the CLI.
Now all of these options can be provided in a single command:
aptible db:create --container-profile r --container-size 1024 --iops 4000
The same changes also apply to:
aptible db:replicateaptible backup:restore
The same changes also apply to deploying an
Appfor the first time:aptible deploy --container-profile r --container-size 1024 --container-count 2
Users can now provide
--container-profiletoaptible apps:scaleandaptible db:restart
New version of CLI available here for download.
Aptible Terraform
Users can now provide disk IOPS for Database and Replica resources
We improved the performance of scaling an App resource
Aptible UI
When creating a Database resource, users can now provide scaling options (container profile, disk size, container size, container profile, and IOPS)
Aug 5, 2024
Aug 5, 2024
We released a set of changes to our clients (UI, CLI, and Terraform) to make it easier for users to provision Apps and Databases with the desired scaling options. Previously, this had to be accomplished in two steps. For example, previously in the CLI, if a user was creating a PostgreSQL Database using our RAM Optimized container profile and 4000 IOPS, they would have to:
Create the database
aptible db:create(which defaults to our General Purpose container profile and3000IOPS)Then use the web UI to immediately scale the resource
As you can read, this is a disjointed user experience and we are happy to announce that we have feature parity across all of our clients.
Aptible CLI
Users can now provide scaling options (container profile, container count, container size, disk size, or IOPS) upon creation of an App or Database via the CLI.
Now all of these options can be provided in a single command:
aptible db:create --container-profile r --container-size 1024 --iops 4000
The same changes also apply to:
aptible db:replicateaptible backup:restore
The same changes also apply to deploying an
Appfor the first time:aptible deploy --container-profile r --container-size 1024 --container-count 2
Users can now provide
--container-profiletoaptible apps:scaleandaptible db:restart
New version of CLI available here for download.
Aptible Terraform
Users can now provide disk IOPS for Database and Replica resources
We improved the performance of scaling an App resource
Aptible UI
When creating a Database resource, users can now provide scaling options (container profile, disk size, container size, container profile, and IOPS)
Aug 5, 2024
Jul 25, 2024
As of 07/25/2024, all new Environments will have a default backup retention policy of:
30 daily backups
12 monthly backups
6 yearly backups
Cross-region copies disabled
Keep final backups enabled
This configuration still maintains 6 years of backups, as the previous default did, but reduces the overall number of backups retained over that period by over 6x, saving a significant amount on backup costs within a few months of databases coming online.
We've also added the backup recommendations in-app to make it easier to optimize existing environments.
Jul 25, 2024
Jul 25, 2024
As of 07/25/2024, all new Environments will have a default backup retention policy of:
30 daily backups
12 monthly backups
6 yearly backups
Cross-region copies disabled
Keep final backups enabled
This configuration still maintains 6 years of backups, as the previous default did, but reduces the overall number of backups retained over that period by over 6x, saving a significant amount on backup costs within a few months of databases coming online.
We've also added the backup recommendations in-app to make it easier to optimize existing environments.
Jul 25, 2024
Jul 23, 2024
Backup Retention Policies can now be managed via Terraform.
The backup_retention_policy block can be used to minimize cost or extend retention for Terraform-managed environments. Additionally, keep_final backups can also be disabled via Terraform; this allows forterraform destroy environments to work more efficiently as you no longer have to manually clean up final backups within the CLI or UI.
Jul 23, 2024
Jul 23, 2024
Backup Retention Policies can now be managed via Terraform.
The backup_retention_policy block can be used to minimize cost or extend retention for Terraform-managed environments. Additionally, keep_final backups can also be disabled via Terraform; this allows forterraform destroy environments to work more efficiently as you no longer have to manually clean up final backups within the CLI or UI.
Jul 23, 2024
Jul 23, 2024
Database versions without active developer or community support will now be marked as (EOL) in the Dashboard. Additionally, after a 90-day period, EOL databases will be marked as (DEPRECATED) and will no longer be provisionable through the UI or CLI.
Following this policy, you will be unable to provision the following databases on October 31, 2024:
Redis 6.0 and below
PostgreSQL 11 and below
MySQL 5.7 and below
Elasticsearch 7.9 and below
MongoDB 3.6 and below
RabbitMQ 3.9 and below
CouchDB
Notably, MongoDB 4.0 and Elasticsearch 7.10 will continue to be offered indefinitely, and CouchDB will no longer be available for new provisions on October 31st.
While this will not affect the functionality of any currently deployed databases, we encourage folks using EOL databases to upgrade to take advantage of new features and security measures introduced in later releases. We’ve included a short FAQ below, but if you have any questions regarding this new policy, please reach out to the support team.
FAQ:
Q: Will this affect my ability to backup, restore, or replicate databases on EOL or deprecated versions?
A: No, you will still be able to interact with existing databases in the same manner as before. However, new product features or improvements may not be compatible.
Q: I urgently need to provision a specific database version that is no longer available on Aptible. Can I have an exception?
A: Please get in touch Aptible Support with your specific request, and we’ll work with you to find an alternative solution.
Q: How can I identify my databases running on end-of-life versions?
A: You can search for "EOL" in the dashboard to filter for databases running on end-of-life versions.
Jul 23, 2024
Jul 23, 2024
Database versions without active developer or community support will now be marked as (EOL) in the Dashboard. Additionally, after a 90-day period, EOL databases will be marked as (DEPRECATED) and will no longer be provisionable through the UI or CLI.
Following this policy, you will be unable to provision the following databases on October 31, 2024:
Redis 6.0 and below
PostgreSQL 11 and below
MySQL 5.7 and below
Elasticsearch 7.9 and below
MongoDB 3.6 and below
RabbitMQ 3.9 and below
CouchDB
Notably, MongoDB 4.0 and Elasticsearch 7.10 will continue to be offered indefinitely, and CouchDB will no longer be available for new provisions on October 31st.
While this will not affect the functionality of any currently deployed databases, we encourage folks using EOL databases to upgrade to take advantage of new features and security measures introduced in later releases. We’ve included a short FAQ below, but if you have any questions regarding this new policy, please reach out to the support team.
FAQ:
Q: Will this affect my ability to backup, restore, or replicate databases on EOL or deprecated versions?
A: No, you will still be able to interact with existing databases in the same manner as before. However, new product features or improvements may not be compatible.
Q: I urgently need to provision a specific database version that is no longer available on Aptible. Can I have an exception?
A: Please get in touch Aptible Support with your specific request, and we’ll work with you to find an alternative solution.
Q: How can I identify my databases running on end-of-life versions?
A: You can search for "EOL" in the dashboard to filter for databases running on end-of-life versions.
Jul 23, 2024
Jun 30, 2024
Operation Blocking Improvements
Our users have given us feedback that certain operations blocking each other can really slow them down at critical moments. Based on that feedback, we've implemented improvements to operations which allow you to work more effectively. Specifically, this includes:
Deploy/scale operations no longer block SSH sessions: Users can now SSH into an app while a deployment or scaling operation is ongoing. This change helps for quick debugging.
Database backups no longer block database operations: Database operations, such as scaling, will no longer be blocked by automatic backups. This change helps for more efficient database management.
Services within a given app can be scaled simultaneously: You can now scale multiple services within a given app at the same time, without waiting for each to complete. This update enables more effective and flexible service scaling.
New 'Last Deploy Banner' in SSH Sessions
With the new ability to SSH into an app during a deployment, we have updated our welcome banner for SSH sessions. The new banner displays:
The date and time of the last completed deploy operation
The source and reference for the deployed code
Jun 30, 2024
Jun 30, 2024
Operation Blocking Improvements
Our users have given us feedback that certain operations blocking each other can really slow them down at critical moments. Based on that feedback, we've implemented improvements to operations which allow you to work more effectively. Specifically, this includes:
Deploy/scale operations no longer block SSH sessions: Users can now SSH into an app while a deployment or scaling operation is ongoing. This change helps for quick debugging.
Database backups no longer block database operations: Database operations, such as scaling, will no longer be blocked by automatic backups. This change helps for more efficient database management.
Services within a given app can be scaled simultaneously: You can now scale multiple services within a given app at the same time, without waiting for each to complete. This update enables more effective and flexible service scaling.
New 'Last Deploy Banner' in SSH Sessions
With the new ability to SSH into an app during a deployment, we have updated our welcome banner for SSH sessions. The new banner displays:
The date and time of the last completed deploy operation
The source and reference for the deployed code
Jun 30, 2024
Jun 12, 2024
We made some changes to the user experience for Role Management. Functionally, roles and permissions have not changed, just the way users interact with roles has been updated:
Users can now more easily view permissions within an Environment, App, and Database. Within a detail page, click the “Settings” tab and you will be able to see all the permissions associated with that entity.
In the role management page, users can now filter by Role, User, and Environment.
We have condensed the role management view to make it easier to navigate and find exactly what you are looking for.
We also now provide an export to CSV button that will print the roles, members, environments, and permissions currently filtered.
We have also condensed the permission editor and streamlined making changes in an effort to make it easier to manage permissions.
Jun 12, 2024
Jun 12, 2024
We made some changes to the user experience for Role Management. Functionally, roles and permissions have not changed, just the way users interact with roles has been updated:
Users can now more easily view permissions within an Environment, App, and Database. Within a detail page, click the “Settings” tab and you will be able to see all the permissions associated with that entity.
In the role management page, users can now filter by Role, User, and Environment.
We have condensed the role management view to make it easier to navigate and find exactly what you are looking for.
We also now provide an export to CSV button that will print the roles, members, environments, and permissions currently filtered.
We have also condensed the permission editor and streamlined making changes in an effort to make it easier to manage permissions.
Jun 12, 2024
Jun 7, 2024
Aptible will now display a container recovery initiated message when a container has restarted due to an event outside of its normal lifecycle. This change helps better differentiate between container restarts due to application deployment and a container recovery event.
Aptible will now display a container recovery initiated message when a container has restarted due to an event outside of its normal lifecycle. This change helps better differentiate between container restarts due to application deployment and a container recovery event.
Jun 7, 2024
Jun 7, 2024
Aptible will now display a container recovery initiated message when a container has restarted due to an event outside of its normal lifecycle. This change helps better differentiate between container restarts due to application deployment and a container recovery event.
Aptible will now display a container recovery initiated message when a container has restarted due to an event outside of its normal lifecycle. This change helps better differentiate between container restarts due to application deployment and a container recovery event.
Jun 7, 2024
Jun 5, 2024

Over the next several weeks, the Aptible team will be migrating VPN Tunnels to new appliances to ensure continued and reliable service. During this time, our team will be reaching out to coordinate the migration.
Once the migration is complete, additional VPN Tunnel details will now be available in the UI. More specifically, VPN Status will now be shown for more effective monitoring/troubleshooting.

Read more about managing VPNs and their status here in our docs.
If you'd like to schedule a migration to the new appliance ahead of time, please contact our support team!
Over the next several weeks, the Aptible team will be migrating VPN Tunnels to new appliances to ensure continued and reliable service. During this time, our team will be reaching out to coordinate the migration.
Once the migration is complete, additional VPN Tunnel details will now be available in the UI. More specifically, VPN Status will now be shown for more effective monitoring/troubleshooting.
Read more about managing VPNs and their status here in our docs.
If you'd like to schedule a migration to the new appliance ahead of time, please contact our support team!
Jun 5, 2024
Jun 5, 2024
Over the next several weeks, the Aptible team will be migrating VPN Tunnels to new appliances to ensure continued and reliable service. During this time, our team will be reaching out to coordinate the migration.
Once the migration is complete, additional VPN Tunnel details will now be available in the UI. More specifically, VPN Status will now be shown for more effective monitoring/troubleshooting.
Read more about managing VPNs and their status here in our docs.
If you'd like to schedule a migration to the new appliance ahead of time, please contact our support team!
Jun 5, 2024
May 31, 2024
New commands for managing backup retention policies via the CLI
Environment Backup Retention Policies can now be managed via the Aptible CLI. Use aptible backup_retention_policy to get the current policy for an Environment and aptible backup_retention_policy:set to change the policy.

Improvements to config:get command
aptible config:get can now be used to get a single value from an App's Configuration.
New commands for managing backup retention policies via the CLI
Environment Backup Retention Policies can now be managed via the Aptible CLI. Use aptible backup_retention_policy to get the current policy for an Environment and aptible backup_retention_policy:set to change the policy.
Improvements to config:get command
aptible config:get can now be used to get a single value from an App's Configuration.
May 31, 2024
May 31, 2024
New commands for managing backup retention policies via the CLI
Environment Backup Retention Policies can now be managed via the Aptible CLI. Use aptible backup_retention_policy to get the current policy for an Environment and aptible backup_retention_policy:set to change the policy.
Improvements to config:get command
aptible config:get can now be used to get a single value from an App's Configuration.
May 31, 2024
May 28, 2024
Previously, the "Dependencies" tab when viewing an App's details on app.aptible.com would only show Aptible Databases that could be detected from the App's configuration (environment variables). Now, it can detect dependencies on other Aptible Apps by comparing domain names detected in the App's configuration with the domains associated with Endpoints. While this method of dependency detection cannot find every dependency an App has, we believe it is a positive step toward making everyone's Aptible architecture easily discoverable.
Previously, the "Dependencies" tab when viewing an App's details on app.aptible.com would only show Aptible Databases that could be detected from the App's configuration (environment variables). Now, it can detect dependencies on other Aptible Apps by comparing domain names detected in the App's configuration with the domains associated with Endpoints. While this method of dependency detection cannot find every dependency an App has, we believe it is a positive step toward making everyone's Aptible architecture easily discoverable.
May 28, 2024
May 28, 2024
Previously, the "Dependencies" tab when viewing an App's details on app.aptible.com would only show Aptible Databases that could be detected from the App's configuration (environment variables). Now, it can detect dependencies on other Aptible Apps by comparing domain names detected in the App's configuration with the domains associated with Endpoints. While this method of dependency detection cannot find every dependency an App has, we believe it is a positive step toward making everyone's Aptible architecture easily discoverable.
Previously, the "Dependencies" tab when viewing an App's details on app.aptible.com would only show Aptible Databases that could be detected from the App's configuration (environment variables). Now, it can detect dependencies on other Aptible Apps by comparing domain names detected in the App's configuration with the domains associated with Endpoints. While this method of dependency detection cannot find every dependency an App has, we believe it is a positive step toward making everyone's Aptible architecture easily discoverable.
May 28, 2024
May 2, 2024

We have introduced a new “Sources” page—designed to track what code is deployed where by linking your apps to their source repositories.
This integration allows for a comprehensive view of deployed code across your infrastructure. You can navigate the Sources page to identify groups of apps sharing the same code source and drill into the Source Details for insights into current and historical changes of code deployed.
May 2, 2024
May 2, 2024
We have introduced a new “Sources” page—designed to track what code is deployed where by linking your apps to their source repositories.
This integration allows for a comprehensive view of deployed code across your infrastructure. You can navigate the Sources page to identify groups of apps sharing the same code source and drill into the Source Details for insights into current and historical changes of code deployed.
May 2, 2024
Mar 13, 2024
To enhance our platform security, Aptible is enforcing a minimum TLS version of TLSv1.2 for all Aptible APIs and sites starting 5/1/2024. Support for TLSv1.0 and TLSv1.1 will be discontinued at this date.
This affects Aptible’s own APIs and sites, including:
Your App Endpoints and Database Endpoints are unaffected by this change.
All modern browsers and operating systems natively support TLSv1.2 already, however if your client is using TLSv1.0 or TLSv1.1, then you must update your client to use TLSv1.2 to continue using Aptible APIs and sites listed above.
For more information on TLSv1.2 compatibility, see this documentation.
Mar 13, 2024
Mar 13, 2024
To enhance our platform security, Aptible is enforcing a minimum TLS version of TLSv1.2 for all Aptible APIs and sites starting 5/1/2024. Support for TLSv1.0 and TLSv1.1 will be discontinued at this date.
This affects Aptible’s own APIs and sites, including:
Your App Endpoints and Database Endpoints are unaffected by this change.
All modern browsers and operating systems natively support TLSv1.2 already, however if your client is using TLSv1.0 or TLSv1.1, then you must update your client to use TLSv1.2 to continue using Aptible APIs and sites listed above.
For more information on TLSv1.2 compatibility, see this documentation.
Mar 13, 2024
Feb 9, 2024
We are happy to announce that Aptible now supports provisioning RabbitMQ 3.12 databases.
We are happy to announce that Aptible now supports provisioning RabbitMQ 3.12 databases.
Feb 9, 2024
Feb 9, 2024
We are happy to announce that Aptible now supports provisioning RabbitMQ 3.12 databases.
We are happy to announce that Aptible now supports provisioning RabbitMQ 3.12 databases.
Feb 9, 2024
Jan 17, 2024
We’ve released a minor version update for MySQL: 8.0.33. This will automatically apply upon the next restart or reload of your MySQL databases.
Configuration Changes
Below are the listed changes that you should be aware of as they are a change in behavior for the current configuration of MySQL.
The SSL Cipher is changing from
DHE-RSA-AES256-SHA256to the new default ofTLS_AES_256_GCM_SHA384TLS 1.0 and 1.1 are no longer supported as of this version. Only TLS 1.2 and 1.3 are available.
If you have any questions or concerns, please contact our Support Team.
Jan 17, 2024
Jan 17, 2024
We’ve released a minor version update for MySQL: 8.0.33. This will automatically apply upon the next restart or reload of your MySQL databases.
Configuration Changes
Below are the listed changes that you should be aware of as they are a change in behavior for the current configuration of MySQL.
The SSL Cipher is changing from
DHE-RSA-AES256-SHA256to the new default ofTLS_AES_256_GCM_SHA384TLS 1.0 and 1.1 are no longer supported as of this version. Only TLS 1.2 and 1.3 are available.
If you have any questions or concerns, please contact our Support Team.
Jan 17, 2024
Dec 30, 2023
Yearly Backups
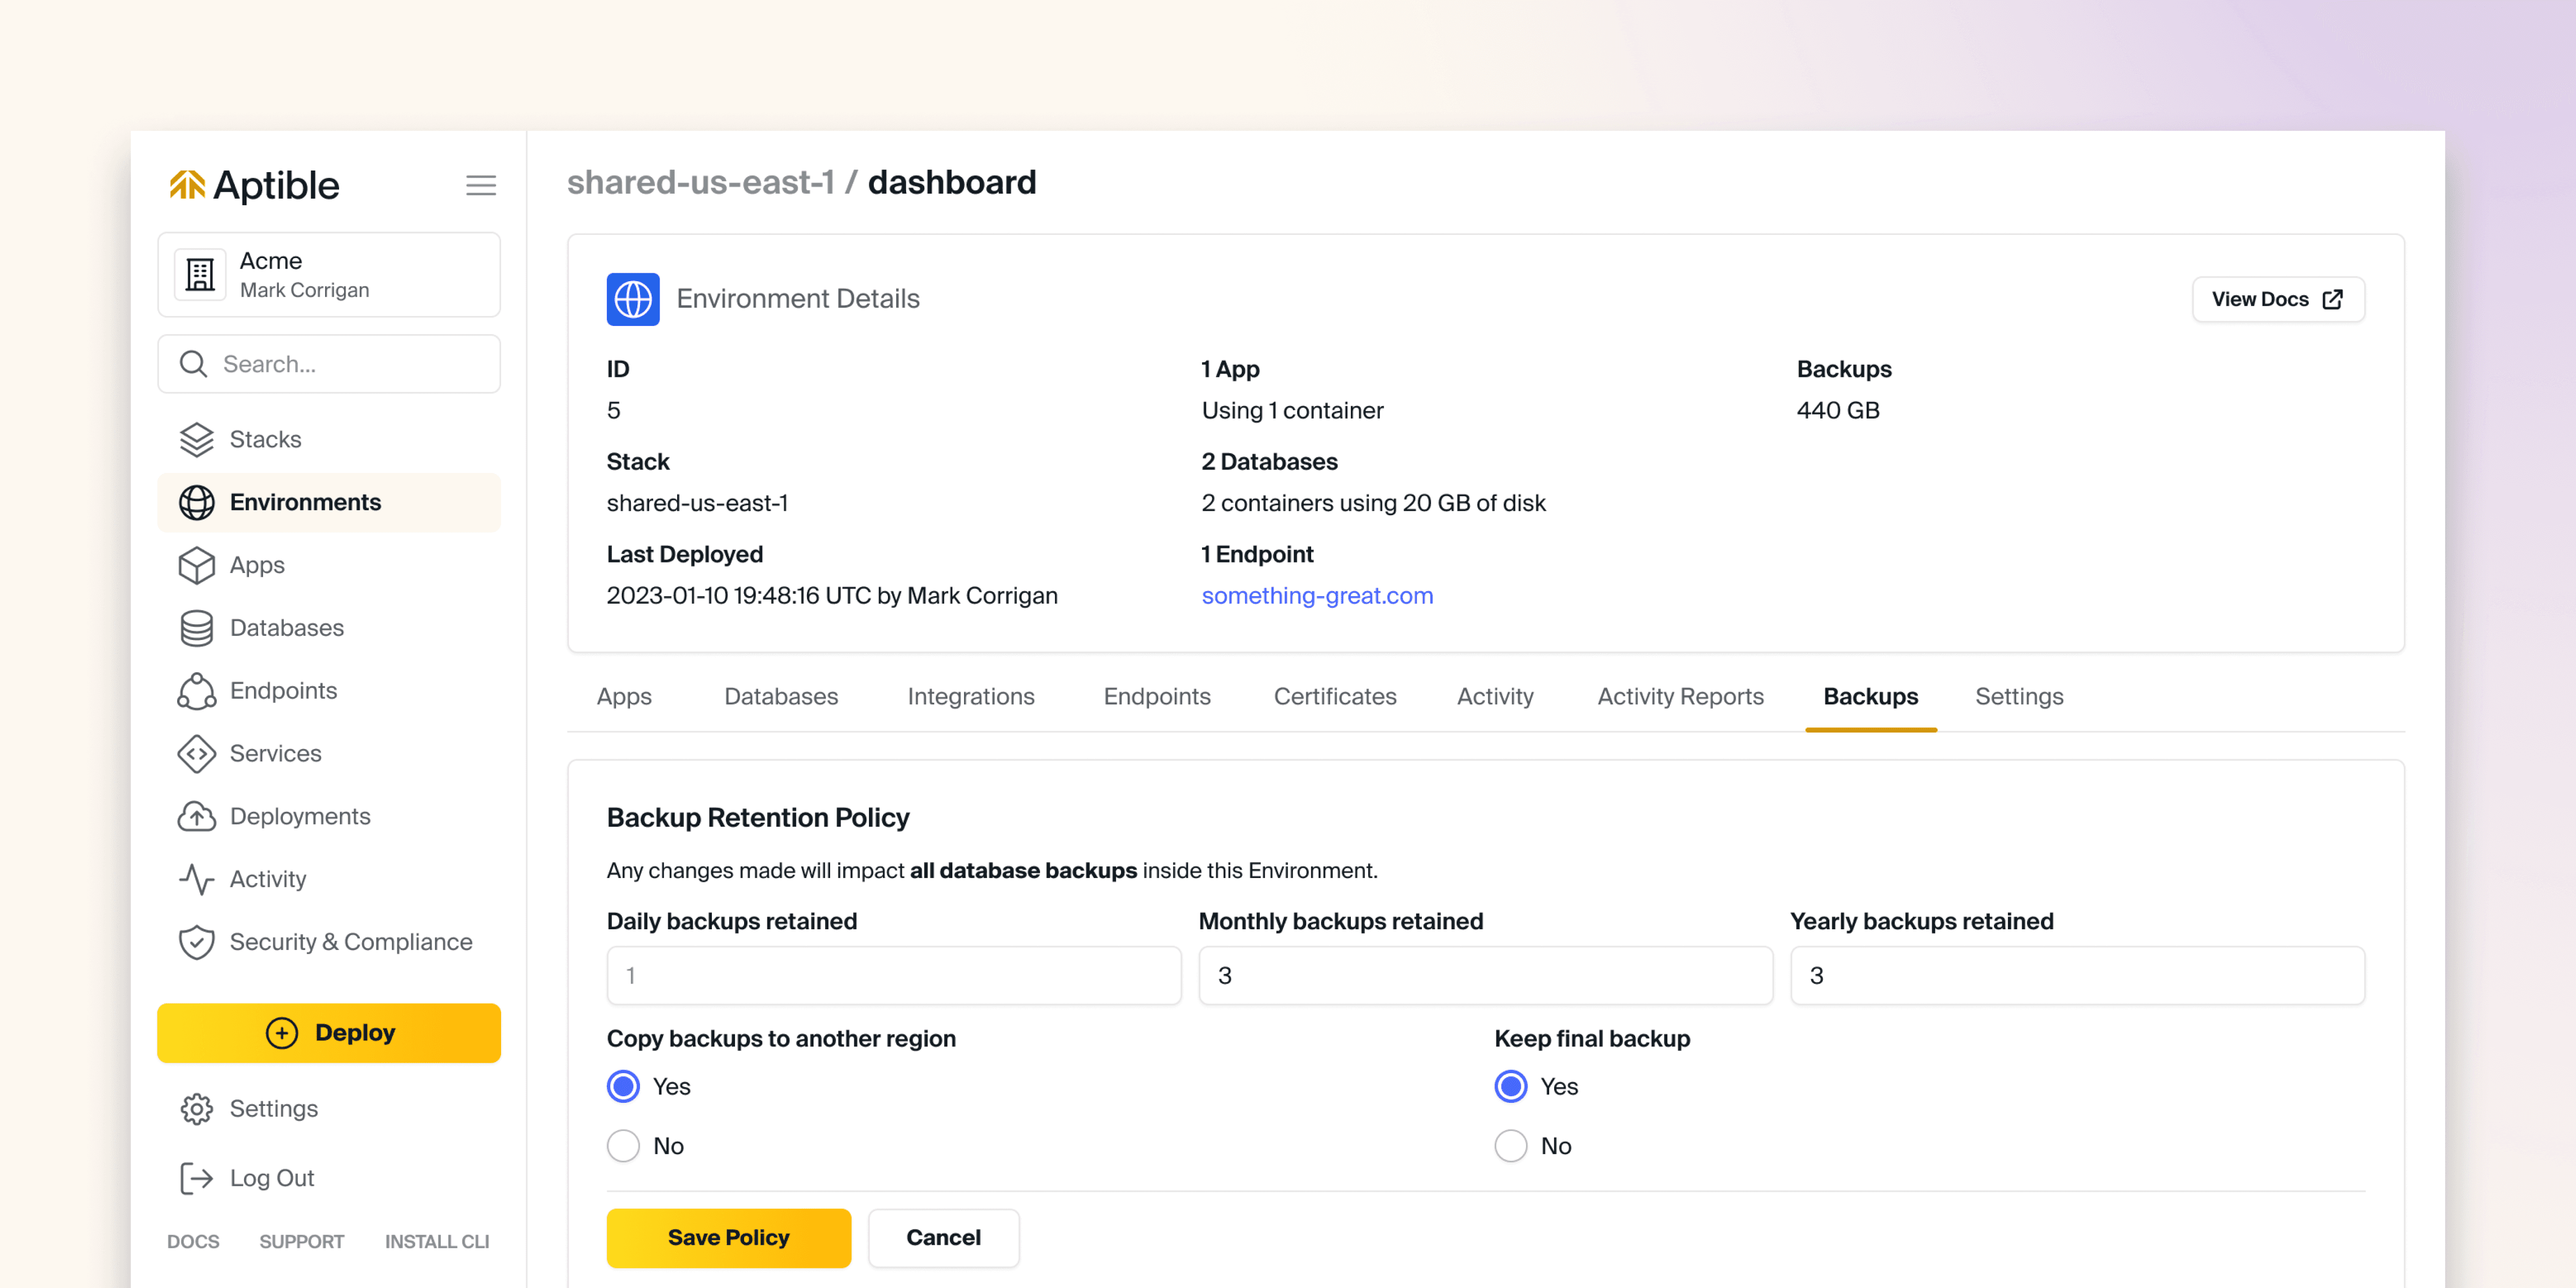
Aptible now supports Yearly automatic backups.
For new and existing environments, the retention policy will be set to 0. We highly recommend reducing the frequency of daily and monthly automatic backups when implementing yearly backups as a cost-optimization measure.
See our docs for more information on automatic yearly backups
Exclude DB from Backups Setting
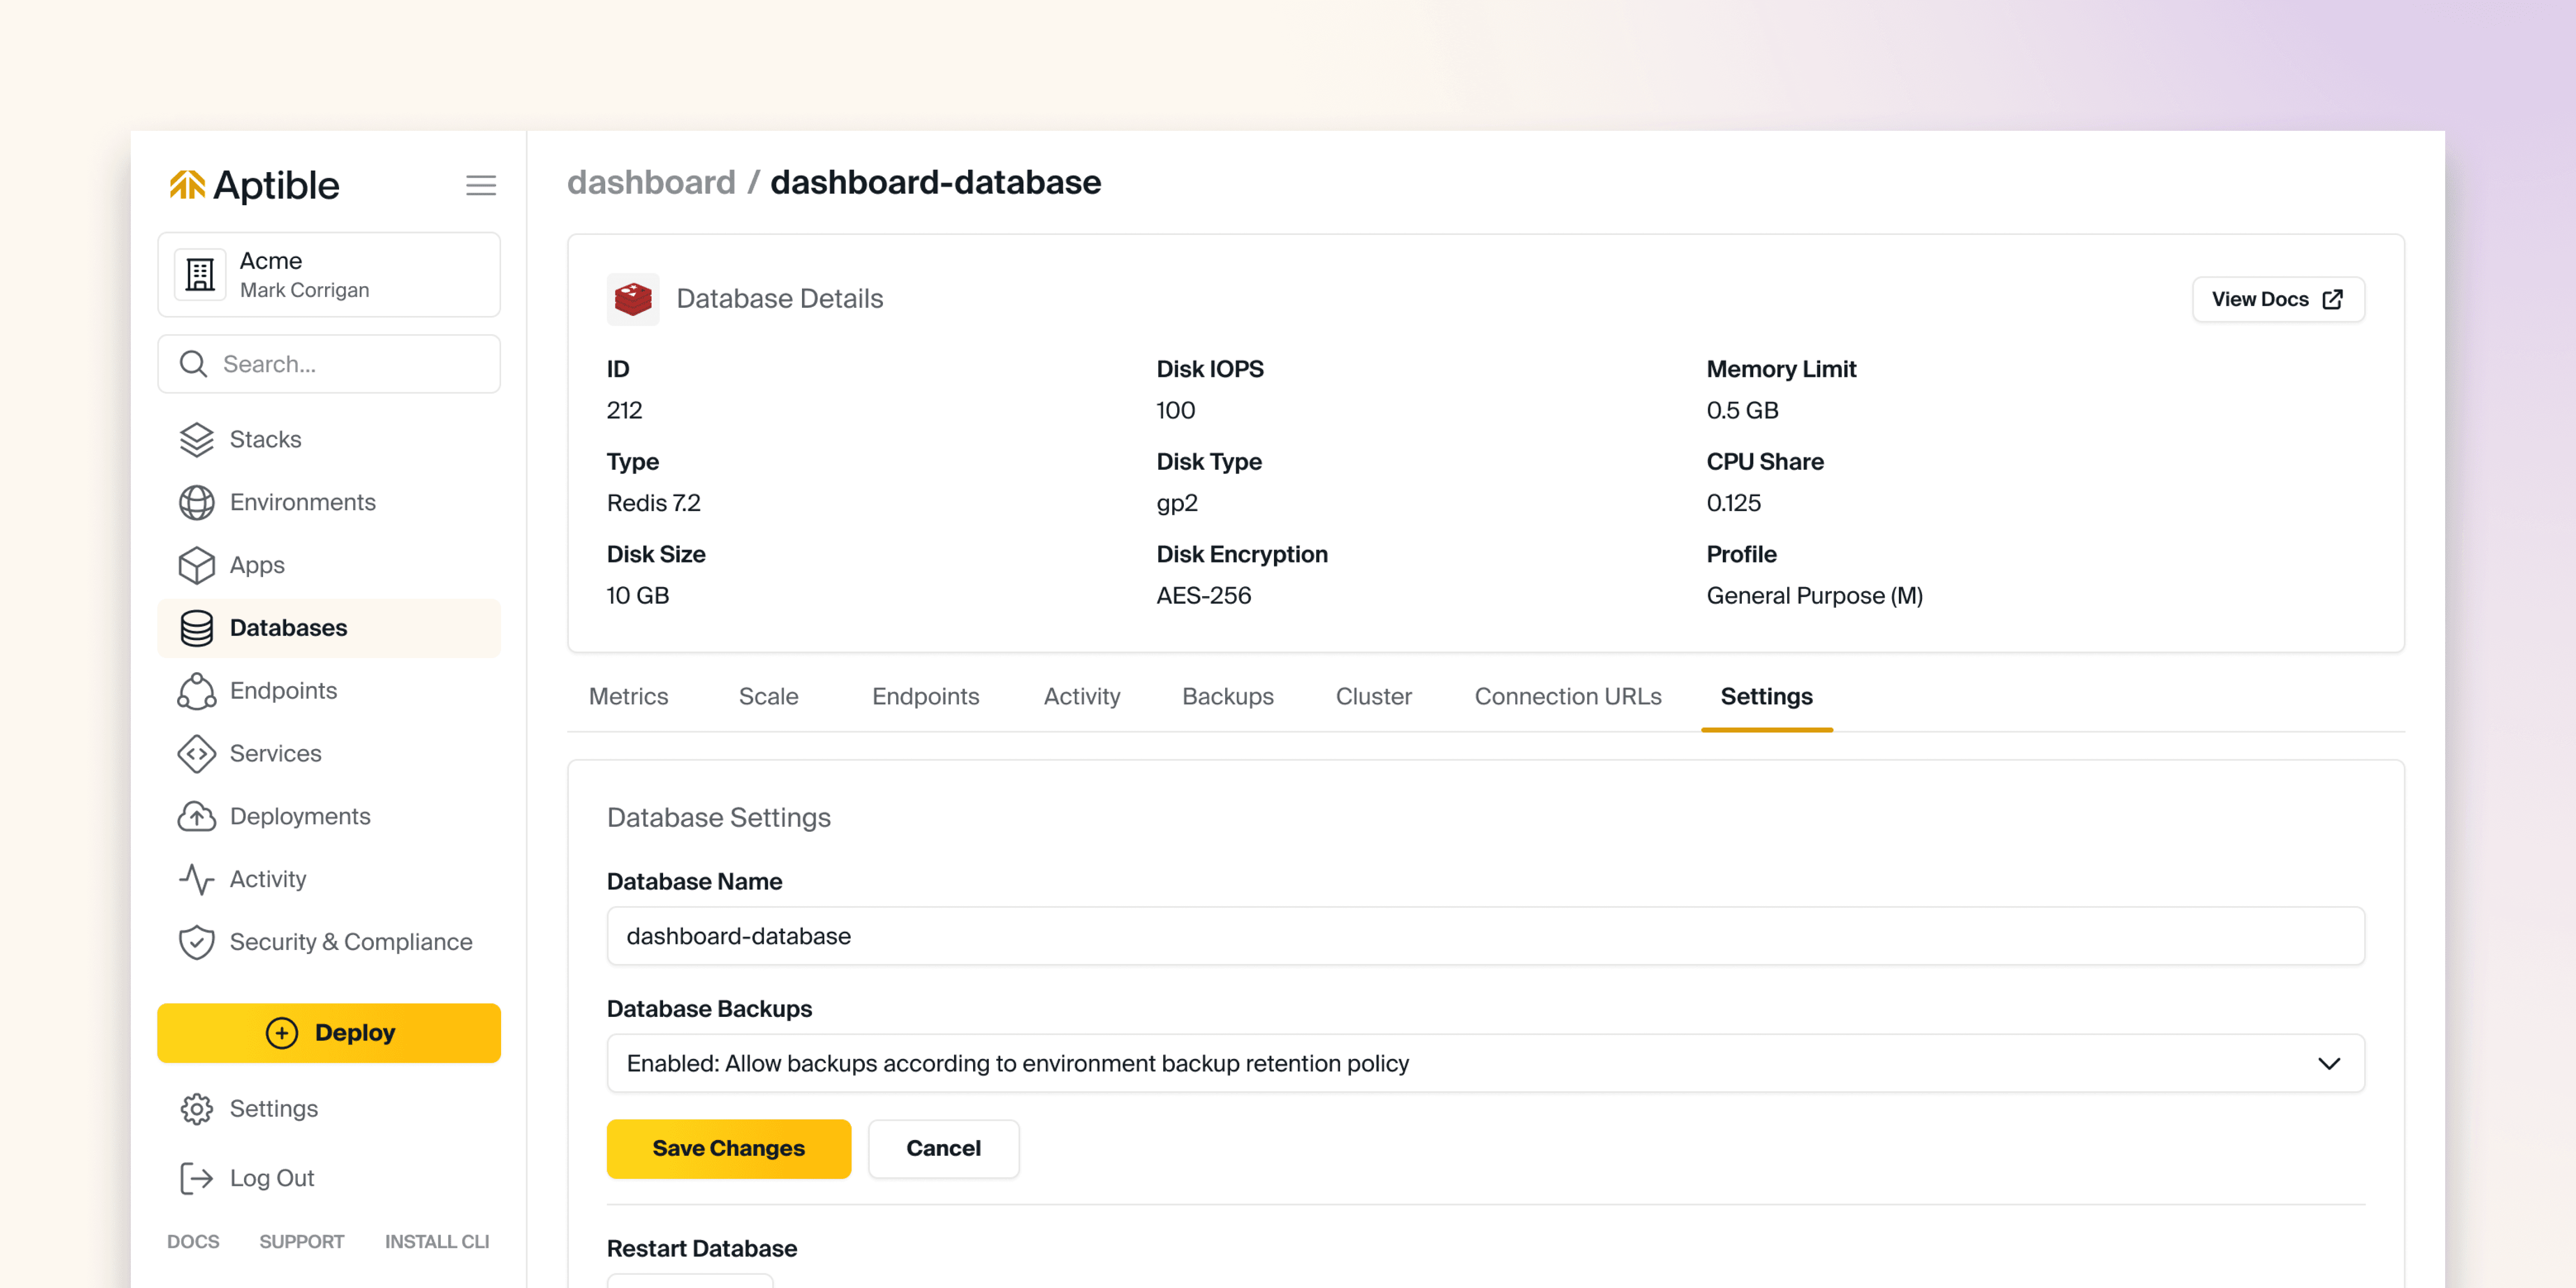
We've introduced a per-database setting which allows for the ability to exclude that database from new automatic backups. Please note: this does not automatically purge previously taken backups.
Yearly Backups
Aptible now supports Yearly automatic backups.
For new and existing environments, the retention policy will be set to 0. We highly recommend reducing the frequency of daily and monthly automatic backups when implementing yearly backups as a cost-optimization measure.
See our docs for more information on automatic yearly backups
Exclude DB from Backups Setting
We've introduced a per-database setting which allows for the ability to exclude that database from new automatic backups. Please note: this does not automatically purge previously taken backups.
Dec 30, 2023
Dec 30, 2023
Yearly Backups
Aptible now supports Yearly automatic backups.
For new and existing environments, the retention policy will be set to 0. We highly recommend reducing the frequency of daily and monthly automatic backups when implementing yearly backups as a cost-optimization measure.
See our docs for more information on automatic yearly backups
Exclude DB from Backups Setting
We've introduced a per-database setting which allows for the ability to exclude that database from new automatic backups. Please note: this does not automatically purge previously taken backups.
Dec 30, 2023
Dec 6, 2023
Aptible is releasing PostgreSQL versions 15 and 16 as a part of our managed database service offering.
Please make note of the following significant changes related to this release:
Aptible will not offer in-place upgrades to PostgreSQL 15 and 16 because of a dependent change in glibc on the underlying Debian operation system. Instead, the following options are available to migrate existing pre-15 PostgreSQL databases to PostgreSQL 15+.
Upgrade PostgreSQL with logical replication
contribimages are being consolidated. Previously, we have maintained two separate PostgreSQL images: acontribimage that included commonly requested extensions and a standard image with only a few critical extensions likepglogical. Starting with PostgreSQL 15, we will no longer maintain a separate image. Instead, we will be bundling extensions into our standard PostgreSQL image. If there is an extension you’d like to see added, please reach out to the team through our support portal.
Dec 6, 2023
Dec 6, 2023
Aptible is releasing PostgreSQL versions 15 and 16 as a part of our managed database service offering.
Please make note of the following significant changes related to this release:
Aptible will not offer in-place upgrades to PostgreSQL 15 and 16 because of a dependent change in glibc on the underlying Debian operation system. Instead, the following options are available to migrate existing pre-15 PostgreSQL databases to PostgreSQL 15+.
Upgrade PostgreSQL with logical replication
contribimages are being consolidated. Previously, we have maintained two separate PostgreSQL images: acontribimage that included commonly requested extensions and a standard image with only a few critical extensions likepglogical. Starting with PostgreSQL 15, we will no longer maintain a separate image. Instead, we will be bundling extensions into our standard PostgreSQL image. If there is an extension you’d like to see added, please reach out to the team through our support portal.
Dec 6, 2023
Nov 30, 2023
The Aptible team has performed maintenance on all customer accounts, which has allowed us to implement the following platform improvements:
Next generation of EC2 hardware: We’ve migrated “General Purpose” containers to the next generation of EC2 hardware for overall better performance
Implemented CPU Shares and deprecated CPU Isolation (formerly CPU limits): Up until now, customers with
CPU Isolation: Disabledhave been able to take advantage of additional CPU resources beyond their allocated limit due to traditional CPU Limits not being enabled and the occasional scheduling of containers on larger infrastructure hosts, which allowed for additional CPU usage. We are transitioning to a CPU-share model with right-sized host matching to improve system efficiency and predictable performance. To provide a practical example, a given app could be running a single 4GB container on a 16GB infrastructure host by itself due to several contributing factors. This container would be allocated a single full CPU but could exceed that by up to 4x (400% CPU utilization). With this new model, this container will be rescheduled on a host closer in size to the container. When the container overruns its single full CPU allocation and reaches the limits of the host’s CPU capacity, it would be throttled to ensure the stability of the host and, by extension, the service. This necessary change lays the groundwork for some exciting upcoming changes, including autoscaling.Maintenance Commands: We have added two new Aptible CLI commands to simplify further the process of ensuring the required App and Database restarts are complete:
aptible maintenance:appsandaptible maintenance:dbs. These commands list Apps and Databases that are required to be restarted to complete any outstanding maintenance and allow customers to track which resources will be restarted by Aptible's SRE time at the indicated maintenance window. Please upgrade your Aptible CLI now to version 0.19.7 or newer to use these commands.Improved API Performance
Nov 30, 2023
Nov 30, 2023
The Aptible team has performed maintenance on all customer accounts, which has allowed us to implement the following platform improvements:
Next generation of EC2 hardware: We’ve migrated “General Purpose” containers to the next generation of EC2 hardware for overall better performance
Implemented CPU Shares and deprecated CPU Isolation (formerly CPU limits): Up until now, customers with
CPU Isolation: Disabledhave been able to take advantage of additional CPU resources beyond their allocated limit due to traditional CPU Limits not being enabled and the occasional scheduling of containers on larger infrastructure hosts, which allowed for additional CPU usage. We are transitioning to a CPU-share model with right-sized host matching to improve system efficiency and predictable performance. To provide a practical example, a given app could be running a single 4GB container on a 16GB infrastructure host by itself due to several contributing factors. This container would be allocated a single full CPU but could exceed that by up to 4x (400% CPU utilization). With this new model, this container will be rescheduled on a host closer in size to the container. When the container overruns its single full CPU allocation and reaches the limits of the host’s CPU capacity, it would be throttled to ensure the stability of the host and, by extension, the service. This necessary change lays the groundwork for some exciting upcoming changes, including autoscaling.Maintenance Commands: We have added two new Aptible CLI commands to simplify further the process of ensuring the required App and Database restarts are complete:
aptible maintenance:appsandaptible maintenance:dbs. These commands list Apps and Databases that are required to be restarted to complete any outstanding maintenance and allow customers to track which resources will be restarted by Aptible's SRE time at the indicated maintenance window. Please upgrade your Aptible CLI now to version 0.19.7 or newer to use these commands.Improved API Performance
Nov 30, 2023
Nov 3, 2023
Account Owners can now reset a user's 2FA in the Members page under Settings. Account Owners can reset 2FA for all other users, including other Account Owners, but cannot reset their own 2FA. Once the Account Owner kicks off the reset, the selected user will receive an email with a link asking that they confirm and complete the 2FA reset.
Account Owners can now reset a user's 2FA in the Members page under Settings. Account Owners can reset 2FA for all other users, including other Account Owners, but cannot reset their own 2FA. Once the Account Owner kicks off the reset, the selected user will receive an email with a link asking that they confirm and complete the 2FA reset.
Nov 3, 2023
Nov 3, 2023
Account Owners can now reset a user's 2FA in the Members page under Settings. Account Owners can reset 2FA for all other users, including other Account Owners, but cannot reset their own 2FA. Once the Account Owner kicks off the reset, the selected user will receive an email with a link asking that they confirm and complete the 2FA reset.
Account Owners can now reset a user's 2FA in the Members page under Settings. Account Owners can reset 2FA for all other users, including other Account Owners, but cannot reset their own 2FA. Once the Account Owner kicks off the reset, the selected user will receive an email with a link asking that they confirm and complete the 2FA reset.
Nov 3, 2023
Oct 31, 2023
We're excited to share further improvements to the new Aptible Dashboard, which is currently in Beta. The latest additions:
A new Endpoints page to view and manage all Endpoints within an organization
A new support request form directly via the Dashboard — built with smart suggestions
Apps and Databases can now be restarted via the Dashboard
Databases can be migrated to a new region with the
Restart Database with Disk Backup and RestoresettingsInfluxDB 2 Metric Drains are now supported via the new Dashboard
Environment Variables are now viewable and configurable via the Dashboard
Bug fixes
Oct 31, 2023
Oct 31, 2023
We're excited to share further improvements to the new Aptible Dashboard, which is currently in Beta. The latest additions:
A new Endpoints page to view and manage all Endpoints within an organization
A new support request form directly via the Dashboard — built with smart suggestions
Apps and Databases can now be restarted via the Dashboard
Databases can be migrated to a new region with the
Restart Database with Disk Backup and RestoresettingsInfluxDB 2 Metric Drains are now supported via the new Dashboard
Environment Variables are now viewable and configurable via the Dashboard
Bug fixes
Oct 31, 2023
Sep 30, 2023

We’re excited to announce a preview of our new Aptible Dashboard, which is currently in Beta. With this new Dashboard, we aim to improve our platform's navigation, speed, and usability — focusing on the overall developer experience.
We’re just getting started, but to kick things off, you can try the new Dashboard here with the following features:
An entirely fresh new look to the Dashboard
A new navigation with per-resource pages to hone in on the resources you are looking for, including dedicated pages for Stacks, Environments, Apps, and Databases
A new Activity page to easily view and manage operations, including operation logs
A new Deployments page to manage deployments triggered via the Dashboard
Omni-search for resources across the entire organization
In-app metrics now persist after deploys and restarts
In-app metrics now show a 1-week look back (in addition to hourly and daily) with more granularity than ever before
Sep 30, 2023
Sep 30, 2023
We’re excited to announce a preview of our new Aptible Dashboard, which is currently in Beta. With this new Dashboard, we aim to improve our platform's navigation, speed, and usability — focusing on the overall developer experience.
We’re just getting started, but to kick things off, you can try the new Dashboard here with the following features:
An entirely fresh new look to the Dashboard
A new navigation with per-resource pages to hone in on the resources you are looking for, including dedicated pages for Stacks, Environments, Apps, and Databases
A new Activity page to easily view and manage operations, including operation logs
A new Deployments page to manage deployments triggered via the Dashboard
Omni-search for resources across the entire organization
In-app metrics now persist after deploys and restarts
In-app metrics now show a 1-week look back (in addition to hourly and daily) with more granularity than ever before
Sep 30, 2023
Jul 27, 2023
Aptible now supports Redis 6.2. To upgrade your Redis database, please see our guide for “How to upgrade Redis”
Aptible now supports Redis 6.2. To upgrade your Redis database, please see our guide for “How to upgrade Redis”
Jul 27, 2023
Jul 27, 2023
Aptible now supports Redis 6.2. To upgrade your Redis database, please see our guide for “How to upgrade Redis”
Aptible now supports Redis 6.2. To upgrade your Redis database, please see our guide for “How to upgrade Redis”
Jul 27, 2023
Jun 22, 2023
Aptible will now include a “CPU Limit” metric in the metrics delivered through metric drains so users can understand app and database container performance better.
In the past, Aptible only offered the General Purpose container profile. Since this was standard across all containers, users could easily calculate the CPU limit based on the fixed CPU-to-RAM ratio. The release of RAM and CPU-Optimized container profiles, each with unique CPU-to-RAM ratios, introduced a new need for a CPU Limit metric.
You can compare the existing CPU Usage metric with the new CPU Limit metric to monitor when your app or database containers are nearing their CPU limit, and scale accordingly. However, if CPU Isolation is disabled, the container will have no CPU limit, and the CPU Limit metric will return 0. If you have not enabled CPU Isolation, we highly recommend doing so, as you may experience unpredictable performance in its absence. If CPU Isolation is enabled, the metric returns the allocated CPU per millisecond. For example, a CPU limit of 1 in the dashboard will be reflected as 1000 by the metric, or a CPU limit of .5 in the dashboard will be reflected as 500 by the metric. Please contact Aptible Support if you have any questions before the release.
Please note: as part of this change set, it became necessary to change the host tag to host_name for referencing the Container Hostname (Short Container ID).. Any pre-built queries on customer metrics platforms which rely on the host tag may need to be changed to reference host_name instead.
Jun 22, 2023
Jun 22, 2023
Aptible will now include a “CPU Limit” metric in the metrics delivered through metric drains so users can understand app and database container performance better.
In the past, Aptible only offered the General Purpose container profile. Since this was standard across all containers, users could easily calculate the CPU limit based on the fixed CPU-to-RAM ratio. The release of RAM and CPU-Optimized container profiles, each with unique CPU-to-RAM ratios, introduced a new need for a CPU Limit metric.
You can compare the existing CPU Usage metric with the new CPU Limit metric to monitor when your app or database containers are nearing their CPU limit, and scale accordingly. However, if CPU Isolation is disabled, the container will have no CPU limit, and the CPU Limit metric will return 0. If you have not enabled CPU Isolation, we highly recommend doing so, as you may experience unpredictable performance in its absence. If CPU Isolation is enabled, the metric returns the allocated CPU per millisecond. For example, a CPU limit of 1 in the dashboard will be reflected as 1000 by the metric, or a CPU limit of .5 in the dashboard will be reflected as 500 by the metric. Please contact Aptible Support if you have any questions before the release.
Please note: as part of this change set, it became necessary to change the host tag to host_name for referencing the Container Hostname (Short Container ID).. Any pre-built queries on customer metrics platforms which rely on the host tag may need to be changed to reference host_name instead.
Jun 22, 2023
Jun 22, 2023
Operations completed by the Aptible Reliability Team will now include a note indicating reason the operation (for example: maintenance restarts).
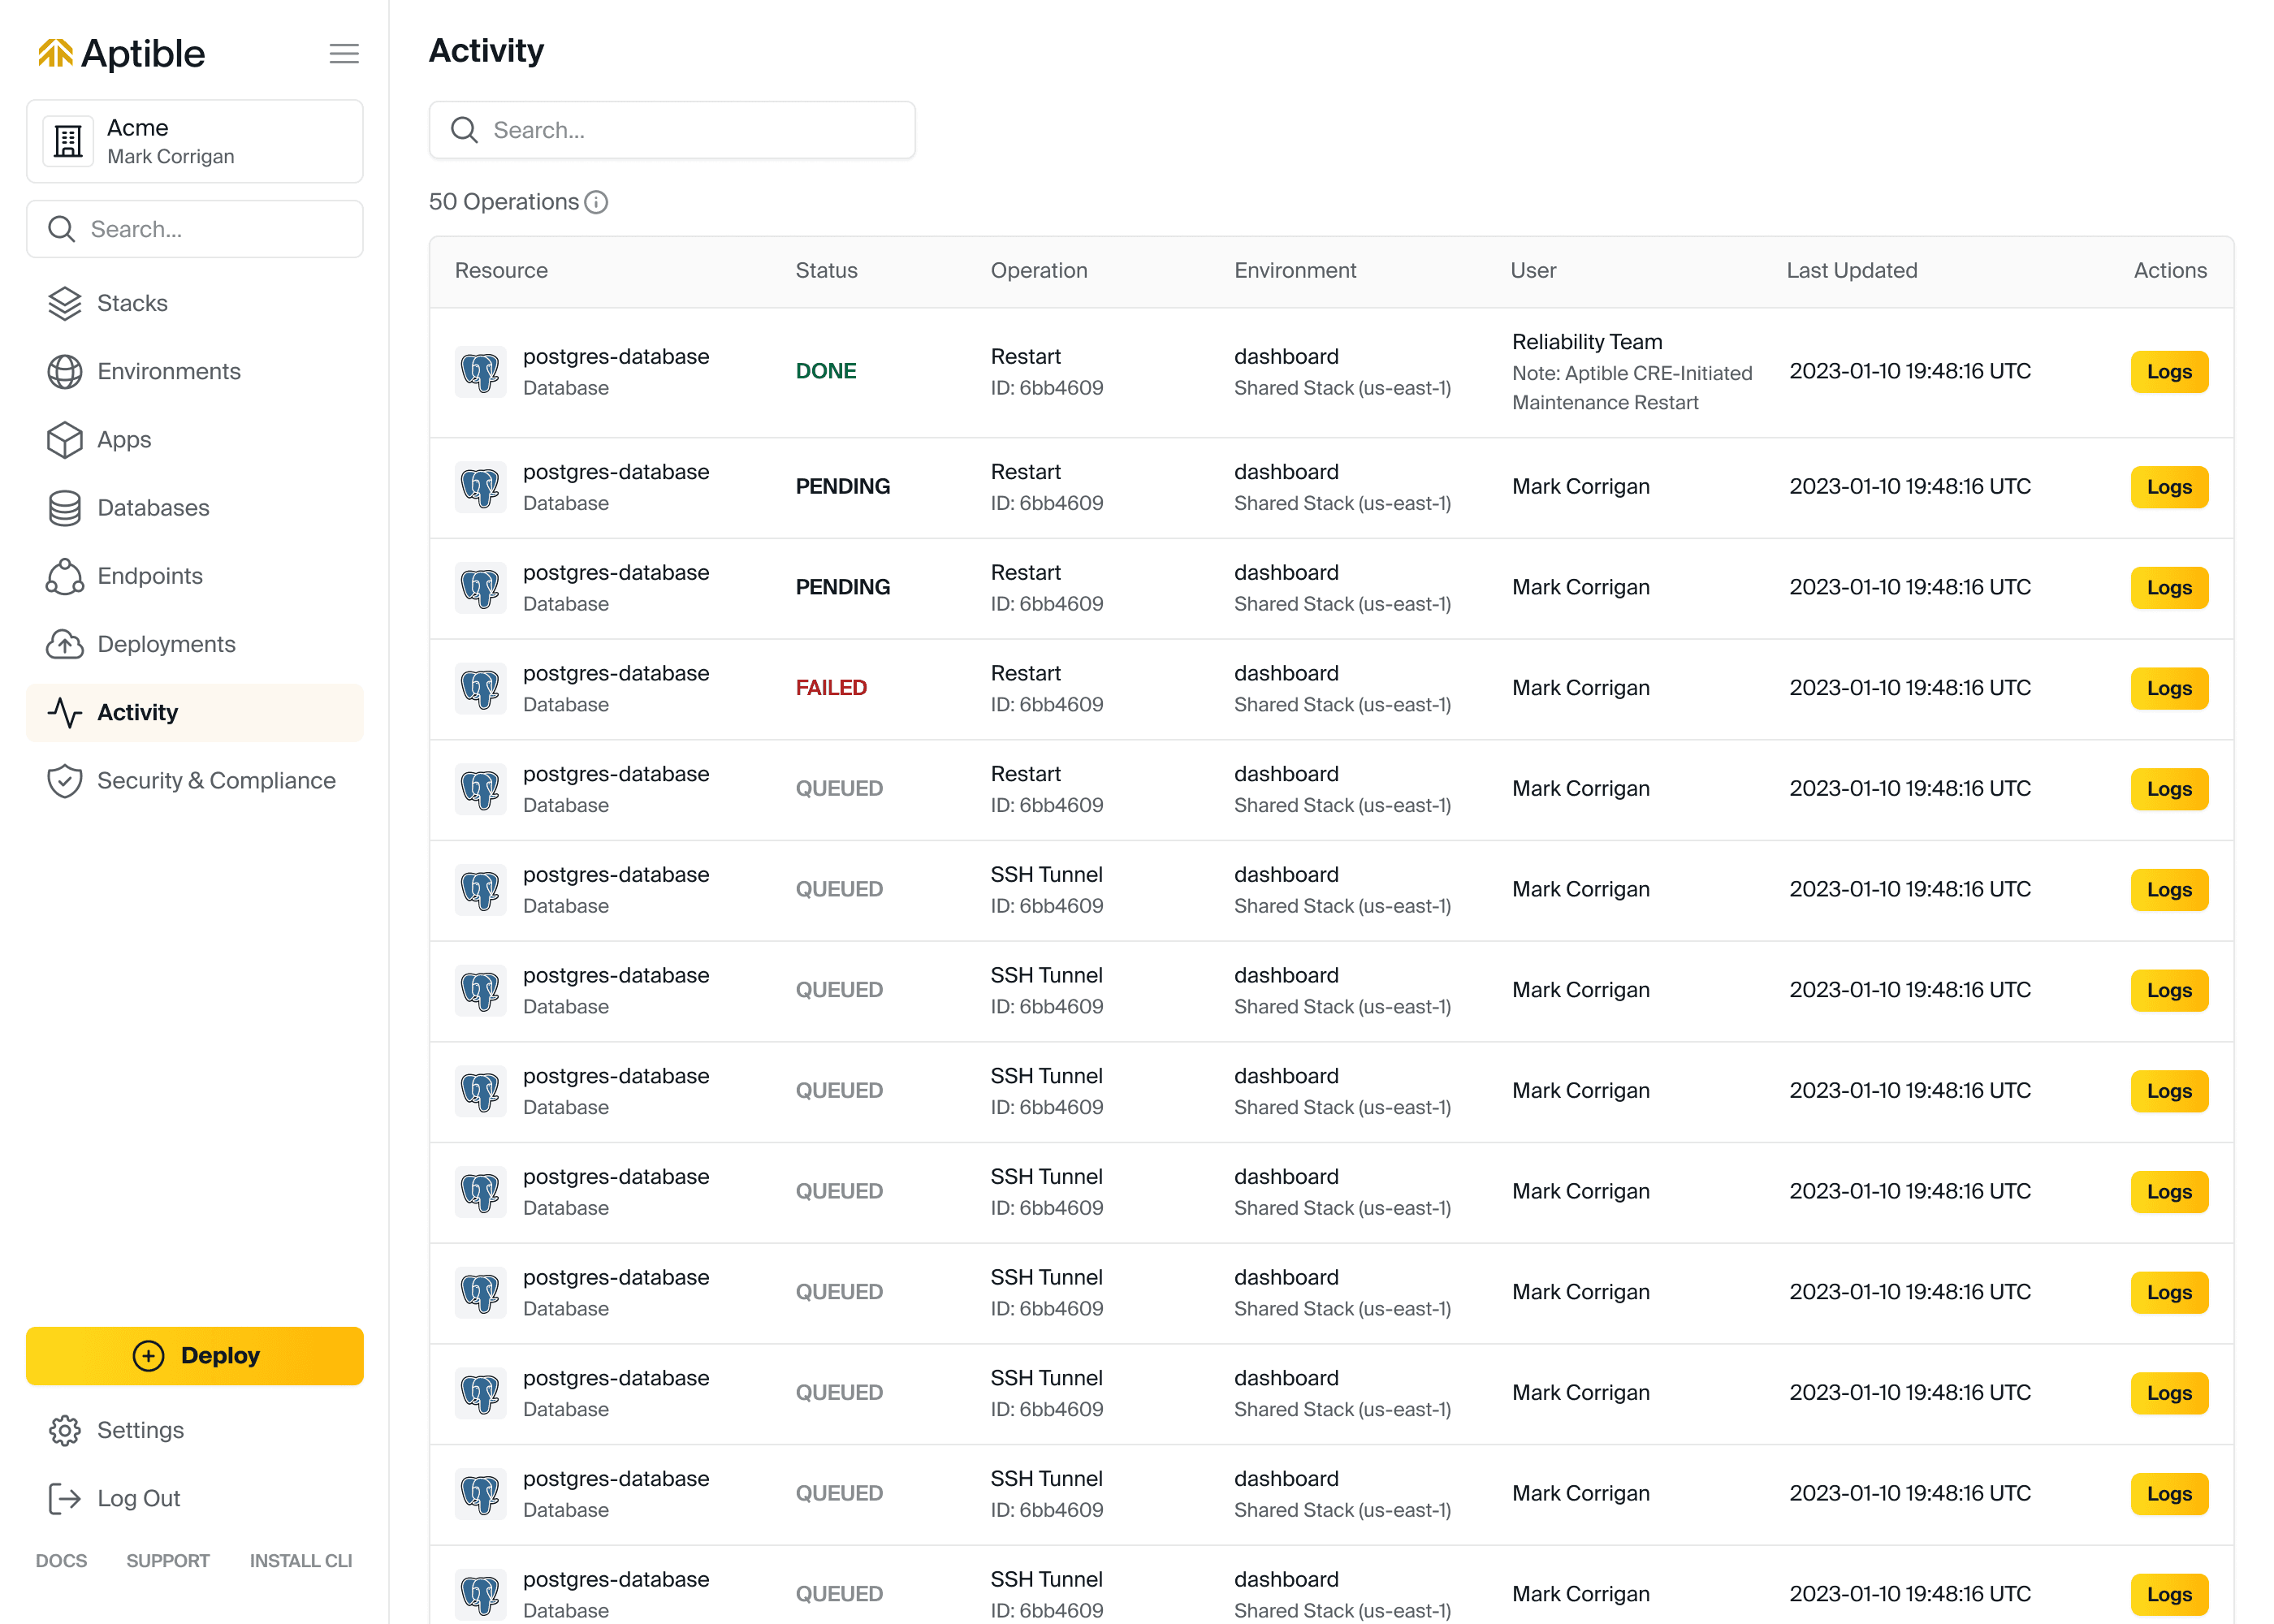
Operations completed by the Aptible Reliability Team will now include a note indicating reason the operation (for example: maintenance restarts).
Jun 22, 2023
Jun 22, 2023
Operations completed by the Aptible Reliability Team will now include a note indicating reason the operation (for example: maintenance restarts).
Operations completed by the Aptible Reliability Team will now include a note indicating reason the operation (for example: maintenance restarts).
Jun 22, 2023
Jun 14, 2023
The maximum amount of IP sources (aka IPv4 addresses and CIDRs) per Endpoint available for IP filtering has been increased from 25 to 50. If you've created multiple Endpoints as a workaround in the past, you may want to consider consolidating back to one Endpoint.
The maximum amount of IP sources (aka IPv4 addresses and CIDRs) per Endpoint available for IP filtering has been increased from 25 to 50. If you've created multiple Endpoints as a workaround in the past, you may want to consider consolidating back to one Endpoint.
Jun 14, 2023
Jun 14, 2023
The maximum amount of IP sources (aka IPv4 addresses and CIDRs) per Endpoint available for IP filtering has been increased from 25 to 50. If you've created multiple Endpoints as a workaround in the past, you may want to consider consolidating back to one Endpoint.
The maximum amount of IP sources (aka IPv4 addresses and CIDRs) per Endpoint available for IP filtering has been increased from 25 to 50. If you've created multiple Endpoints as a workaround in the past, you may want to consider consolidating back to one Endpoint.
Jun 14, 2023
Jun 8, 2023
This year, we announced that we are refocusing our efforts with the goal of delivering ✨magical experiences✨for developers. To deliver on that mission, we created an entirely new experience within the Aptible Dashboard, which allows users to easily deploy code to a new environment with the necessary resources. Whether you're just starting out on Aptible or a seasoned power user, we want to continue to enable you to have a seamless deployment process.
Without further ado, we are happy to introduce you to the new Deploy Code button with the Aptible Dashboard.
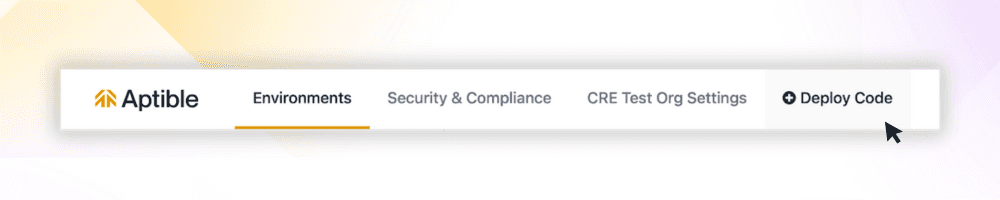
The Deploy Code process will guide you through the following steps:
Setup an SSH Key: Authenticate with Aptible by setting up your SSH key (if you haven't done so already)
Create a new environment: Set up a new environment where your resources will reside
Select app type: Choose the type of app you want to deploy, whether it's from our starter templates, the Aptible demo app, or your own custom code
Push your code: Deploy your code to Aptible using a
git pushCreate databases (optional): Create and configure managed database(s) for your app
Set and configure environment variables (optional): Customize your app by setting and configuring variables
Set Services and Commands (optional): Fine-tune your app's services and commands
View Logs: Track the progress of your resources as they deploy, and if something goes wrong, you edit your configuration and then rerun the deployment – all within the Dashboard
And voilà - your code is deployed! ✨
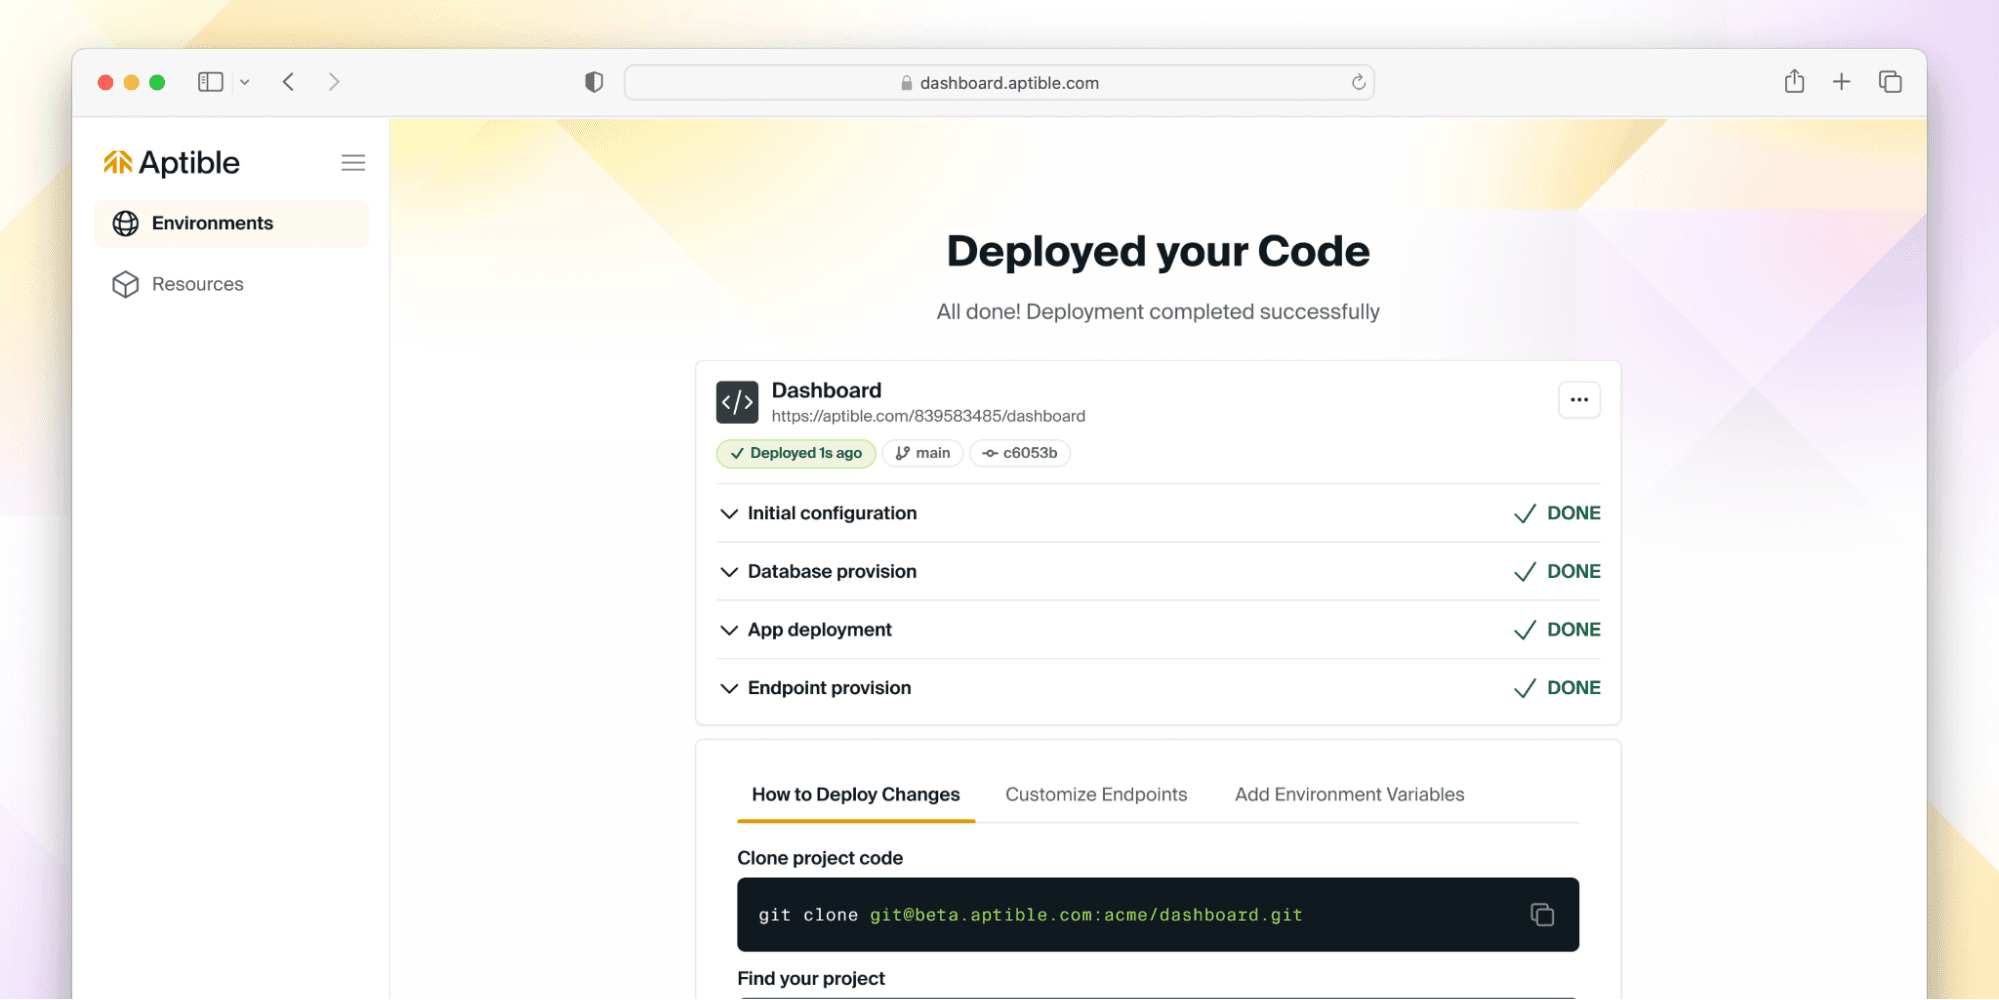
But don’t take our word for it - give it a try here, and if you have ideas or feedback - let us know! We are actively iterating on this flow, so we’d love to hear from you about what you’d like to see next.
This year, we announced that we are refocusing our efforts with the goal of delivering ✨magical experiences✨for developers. To deliver on that mission, we created an entirely new experience within the Aptible Dashboard, which allows users to easily deploy code to a new environment with the necessary resources. Whether you're just starting out on Aptible or a seasoned power user, we want to continue to enable you to have a seamless deployment process.
Without further ado, we are happy to introduce you to the new Deploy Code button with the Aptible Dashboard.
The Deploy Code process will guide you through the following steps:
Setup an SSH Key: Authenticate with Aptible by setting up your SSH key (if you haven't done so already)
Create a new environment: Set up a new environment where your resources will reside
Select app type: Choose the type of app you want to deploy, whether it's from our starter templates, the Aptible demo app, or your own custom code
Push your code: Deploy your code to Aptible using a
git pushCreate databases (optional): Create and configure managed database(s) for your app
Set and configure environment variables (optional): Customize your app by setting and configuring variables
Set Services and Commands (optional): Fine-tune your app's services and commands
View Logs: Track the progress of your resources as they deploy, and if something goes wrong, you edit your configuration and then rerun the deployment – all within the Dashboard
And voilà - your code is deployed! ✨
But don’t take our word for it - give it a try here, and if you have ideas or feedback - let us know! We are actively iterating on this flow, so we’d love to hear from you about what you’d like to see next.
Jun 8, 2023
Jun 8, 2023
This year, we announced that we are refocusing our efforts with the goal of delivering ✨magical experiences✨for developers. To deliver on that mission, we created an entirely new experience within the Aptible Dashboard, which allows users to easily deploy code to a new environment with the necessary resources. Whether you're just starting out on Aptible or a seasoned power user, we want to continue to enable you to have a seamless deployment process.
Without further ado, we are happy to introduce you to the new Deploy Code button with the Aptible Dashboard.
The Deploy Code process will guide you through the following steps:
Setup an SSH Key: Authenticate with Aptible by setting up your SSH key (if you haven't done so already)
Create a new environment: Set up a new environment where your resources will reside
Select app type: Choose the type of app you want to deploy, whether it's from our starter templates, the Aptible demo app, or your own custom code
Push your code: Deploy your code to Aptible using a
git pushCreate databases (optional): Create and configure managed database(s) for your app
Set and configure environment variables (optional): Customize your app by setting and configuring variables
Set Services and Commands (optional): Fine-tune your app's services and commands
View Logs: Track the progress of your resources as they deploy, and if something goes wrong, you edit your configuration and then rerun the deployment – all within the Dashboard
And voilà - your code is deployed! ✨
But don’t take our word for it - give it a try here, and if you have ideas or feedback - let us know! We are actively iterating on this flow, so we’d love to hear from you about what you’d like to see next.
Jun 8, 2023
Mar 1, 2023
We are excited to announce Granular Permissions for fine-tuning user access on the Environment level! Formerly, Aptible had a simple read/write permission scheme, but as part of this release, we've introduced 2 new read permissions and 6 new write permissions, which can be assigned using Custom Roles. Read the docs here or read our blog post.
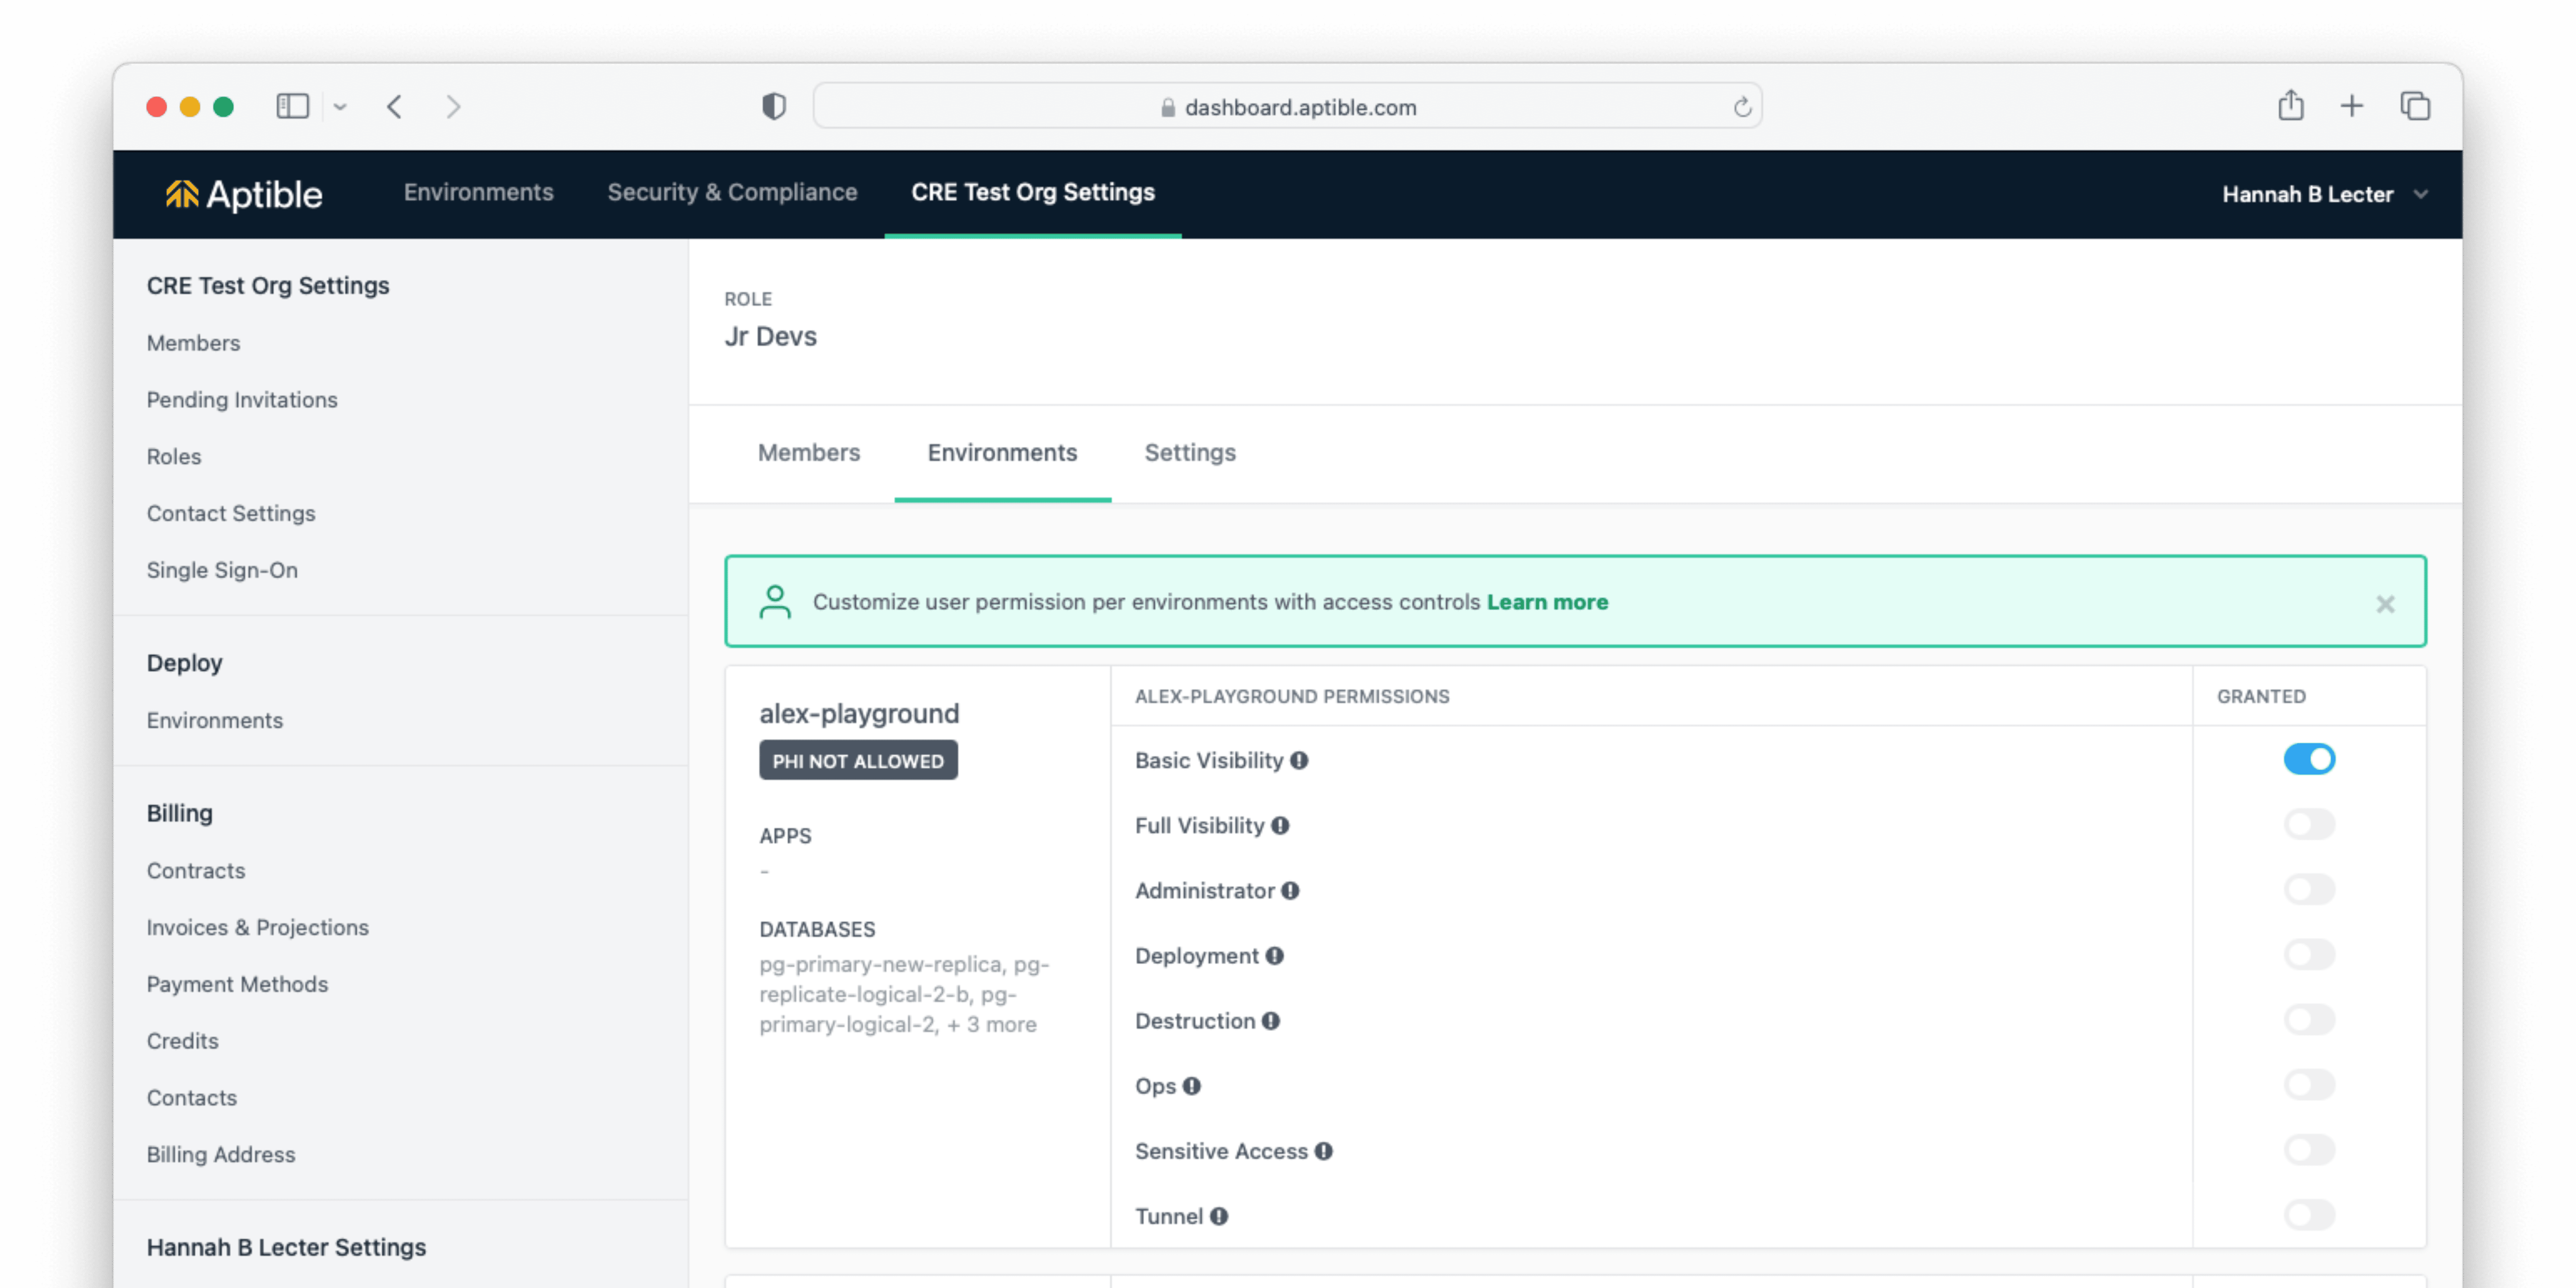
Modifying a Custom Role
Deleting Custom Roles Custom Roles can now be deleted within the Aptible Dashboard. You can do this by navigating to the Custom Role you would like to delete, then navigating to the Settings tab.
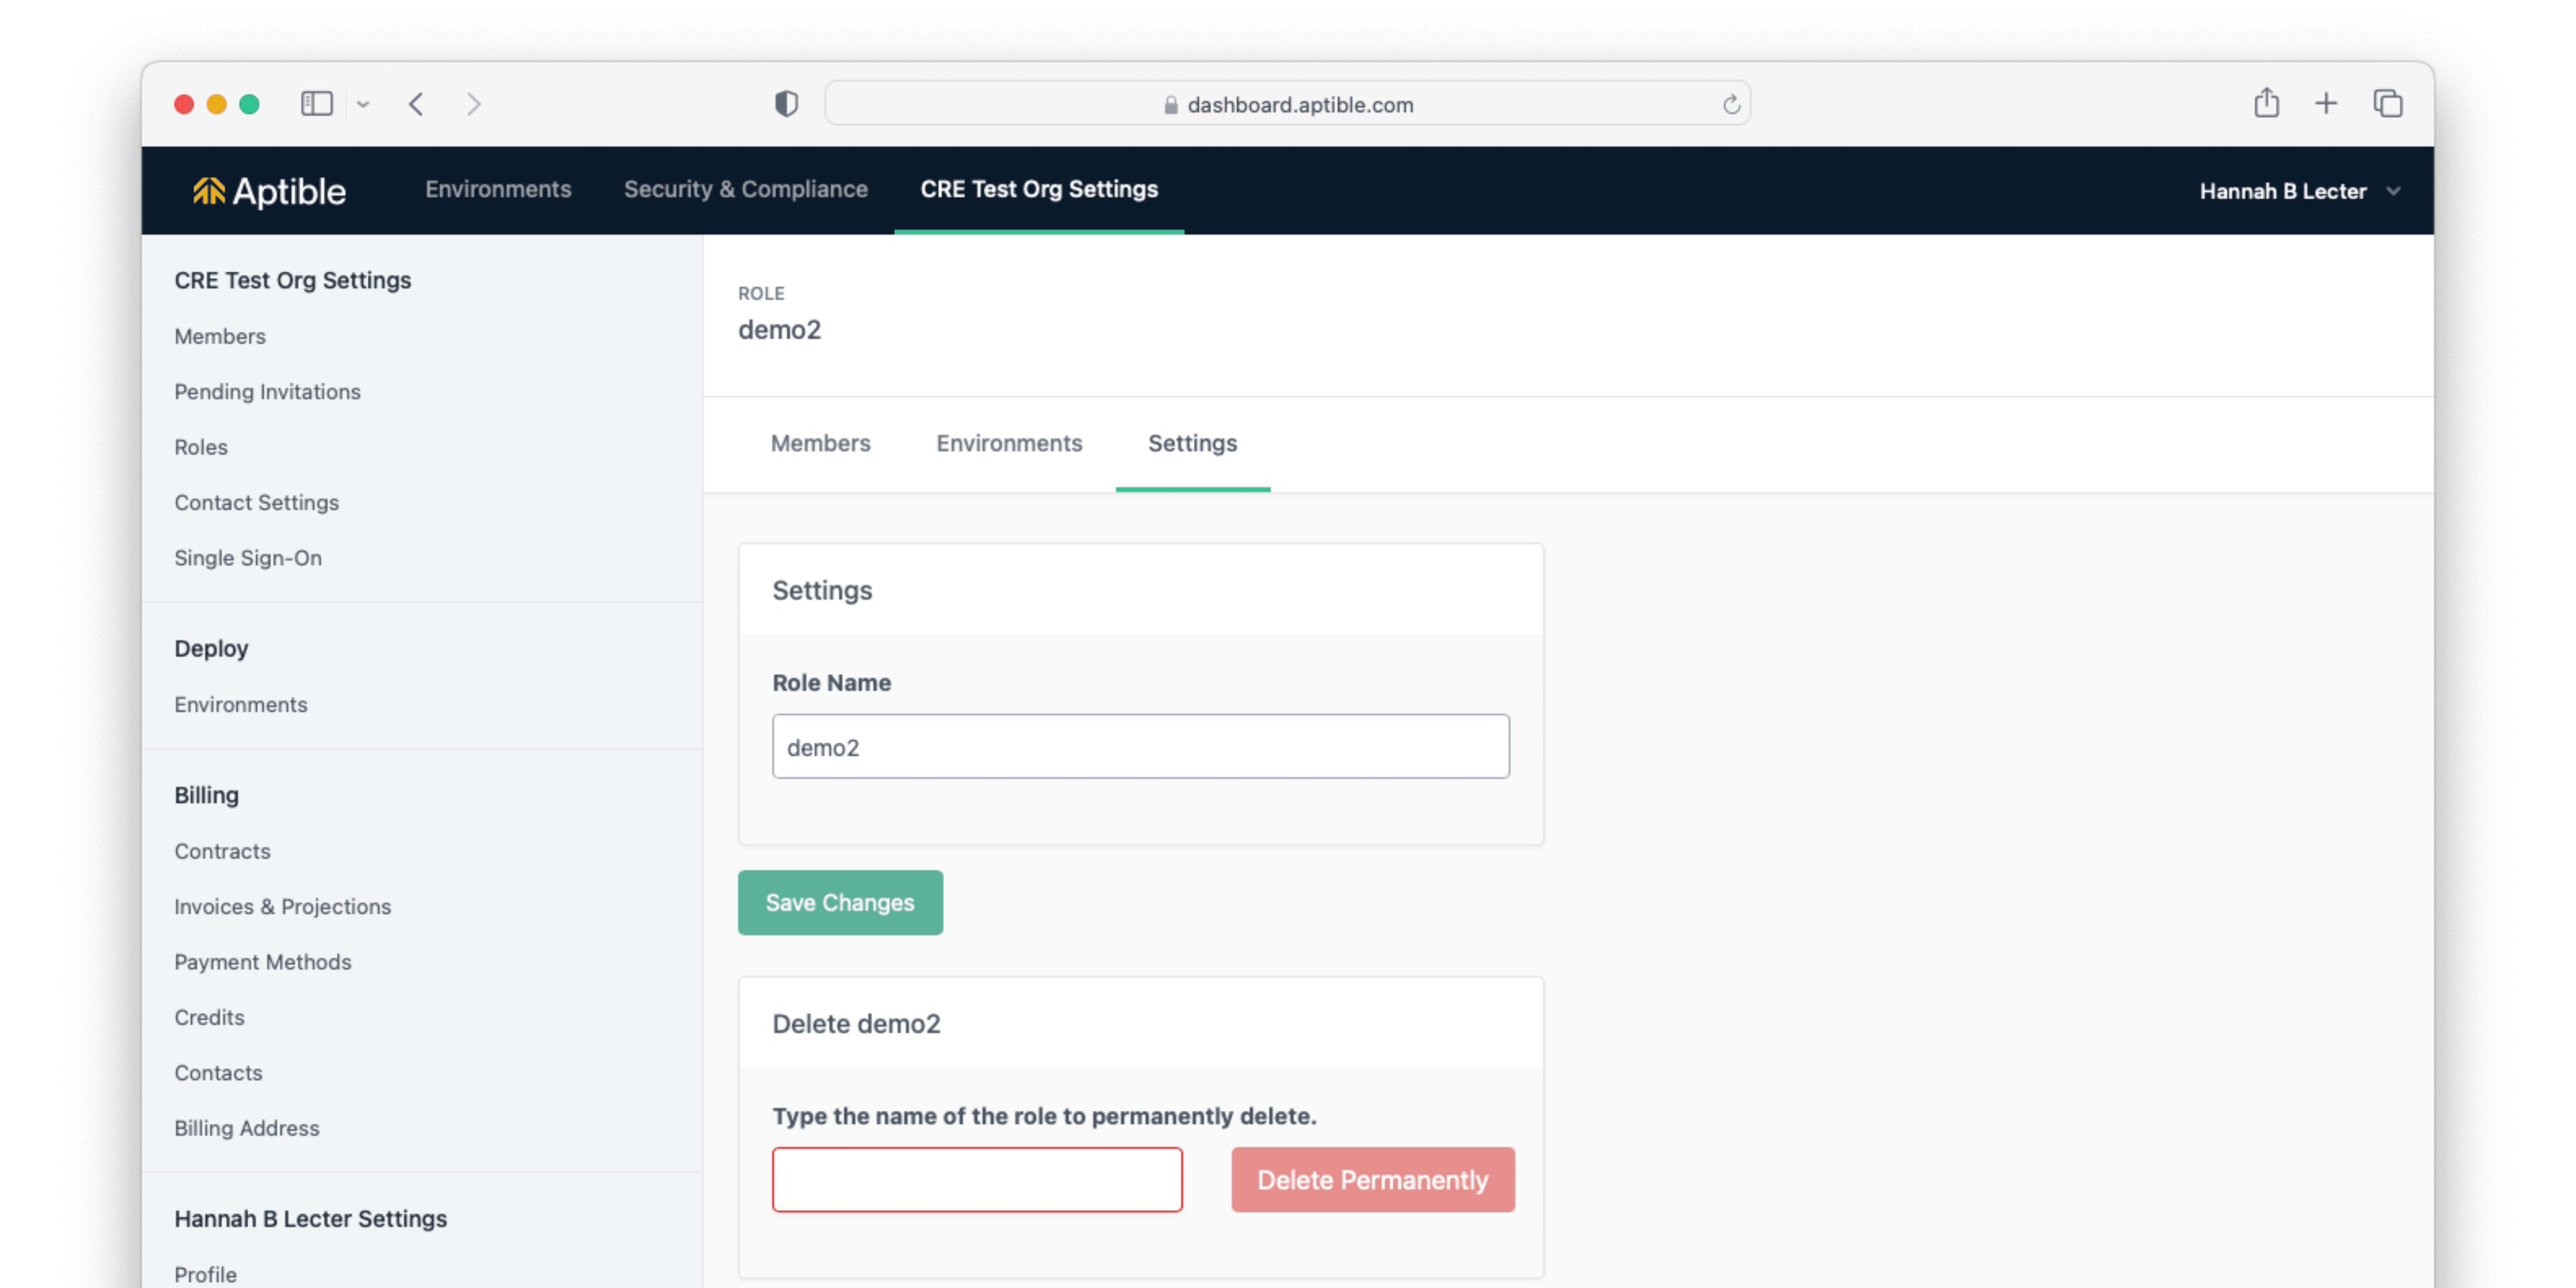
Deleting a Custom Role
We are excited to announce Granular Permissions for fine-tuning user access on the Environment level! Formerly, Aptible had a simple read/write permission scheme, but as part of this release, we've introduced 2 new read permissions and 6 new write permissions, which can be assigned using Custom Roles. Read the docs here or read our blog post.
Modifying a Custom Role
Deleting Custom Roles Custom Roles can now be deleted within the Aptible Dashboard. You can do this by navigating to the Custom Role you would like to delete, then navigating to the Settings tab.
Deleting a Custom Role
Mar 1, 2023
Mar 1, 2023
We are excited to announce Granular Permissions for fine-tuning user access on the Environment level! Formerly, Aptible had a simple read/write permission scheme, but as part of this release, we've introduced 2 new read permissions and 6 new write permissions, which can be assigned using Custom Roles. Read the docs here or read our blog post.
Modifying a Custom Role
Deleting Custom Roles Custom Roles can now be deleted within the Aptible Dashboard. You can do this by navigating to the Custom Role you would like to delete, then navigating to the Settings tab.
Deleting a Custom Role
Mar 1, 2023
Jan 26, 2023
We are excited to announce we've updated our site-to-site VPN tunnel implementation. This update comes with support for IKEv2 VPN tunnels for greater reliability and security, as well as improved compatibility with Azure-based connections.
Learn more about setting up VPN tunnels here.
To request an existing VPN tunnel be migrated to IKEv2, contact Aptible Support.
Jan 26, 2023
Jan 26, 2023
We are excited to announce we've updated our site-to-site VPN tunnel implementation. This update comes with support for IKEv2 VPN tunnels for greater reliability and security, as well as improved compatibility with Azure-based connections.
Learn more about setting up VPN tunnels here.
To request an existing VPN tunnel be migrated to IKEv2, contact Aptible Support.
Jan 26, 2023
Nov 3, 2022
For improved compatibility and security, we've added ED25519 to the supported SSH key algorithms we accept. You can now generate ED25519 SSH keys. You can manage your keys here within the Aptible Dashboard.
For improved compatibility and security, we've added ED25519 to the supported SSH key algorithms we accept. You can now generate ED25519 SSH keys. You can manage your keys here within the Aptible Dashboard.
Nov 3, 2022
Nov 3, 2022
For improved compatibility and security, we've added ED25519 to the supported SSH key algorithms we accept. You can now generate ED25519 SSH keys. You can manage your keys here within the Aptible Dashboard.
For improved compatibility and security, we've added ED25519 to the supported SSH key algorithms we accept. You can now generate ED25519 SSH keys. You can manage your keys here within the Aptible Dashboard.
Nov 3, 2022
Oct 27, 2022
aptible_environment resources can now be managed through Terraform. Learn more here about resource attributes and configuration.
Modify Container Profiles via Terraform container_profile can now be modified for App services and Databases through Terraform. This can be used to select a workload-appropriate Container Profile for a given service: General Purpose, CPU Optimized, or RAM Optimized. Learn more here about resource attributes and configuration.
Look up Stacks via Terraform aptible_stack data sources are now available through Terraform. This can be used to look up Stacks by name. Learn more here about resource attributes.
Oct 27, 2022
Oct 27, 2022
aptible_environment resources can now be managed through Terraform. Learn more here about resource attributes and configuration.
Modify Container Profiles via Terraform container_profile can now be modified for App services and Databases through Terraform. This can be used to select a workload-appropriate Container Profile for a given service: General Purpose, CPU Optimized, or RAM Optimized. Learn more here about resource attributes and configuration.
Look up Stacks via Terraform aptible_stack data sources are now available through Terraform. This can be used to look up Stacks by name. Learn more here about resource attributes.
Oct 27, 2022
Oct 25, 2022
aptible_metric_drain resources can now be managed through Terraform. Learn more here about resource attributes and configuration.
Pre-built Grafana dashboards and alerting You can now use the aptible/metrics Terraform module to provision Metric Drains with pre-built Grafana dashboards and alerts for monitoring RAM & CPU usage for your Apps & Databases. This simplifies the setup of Metric Drains so you can start monitoring your Aptible resources immediately, all hosted within your Aptible account!

App metrics in the pre-built Grafana dashboard
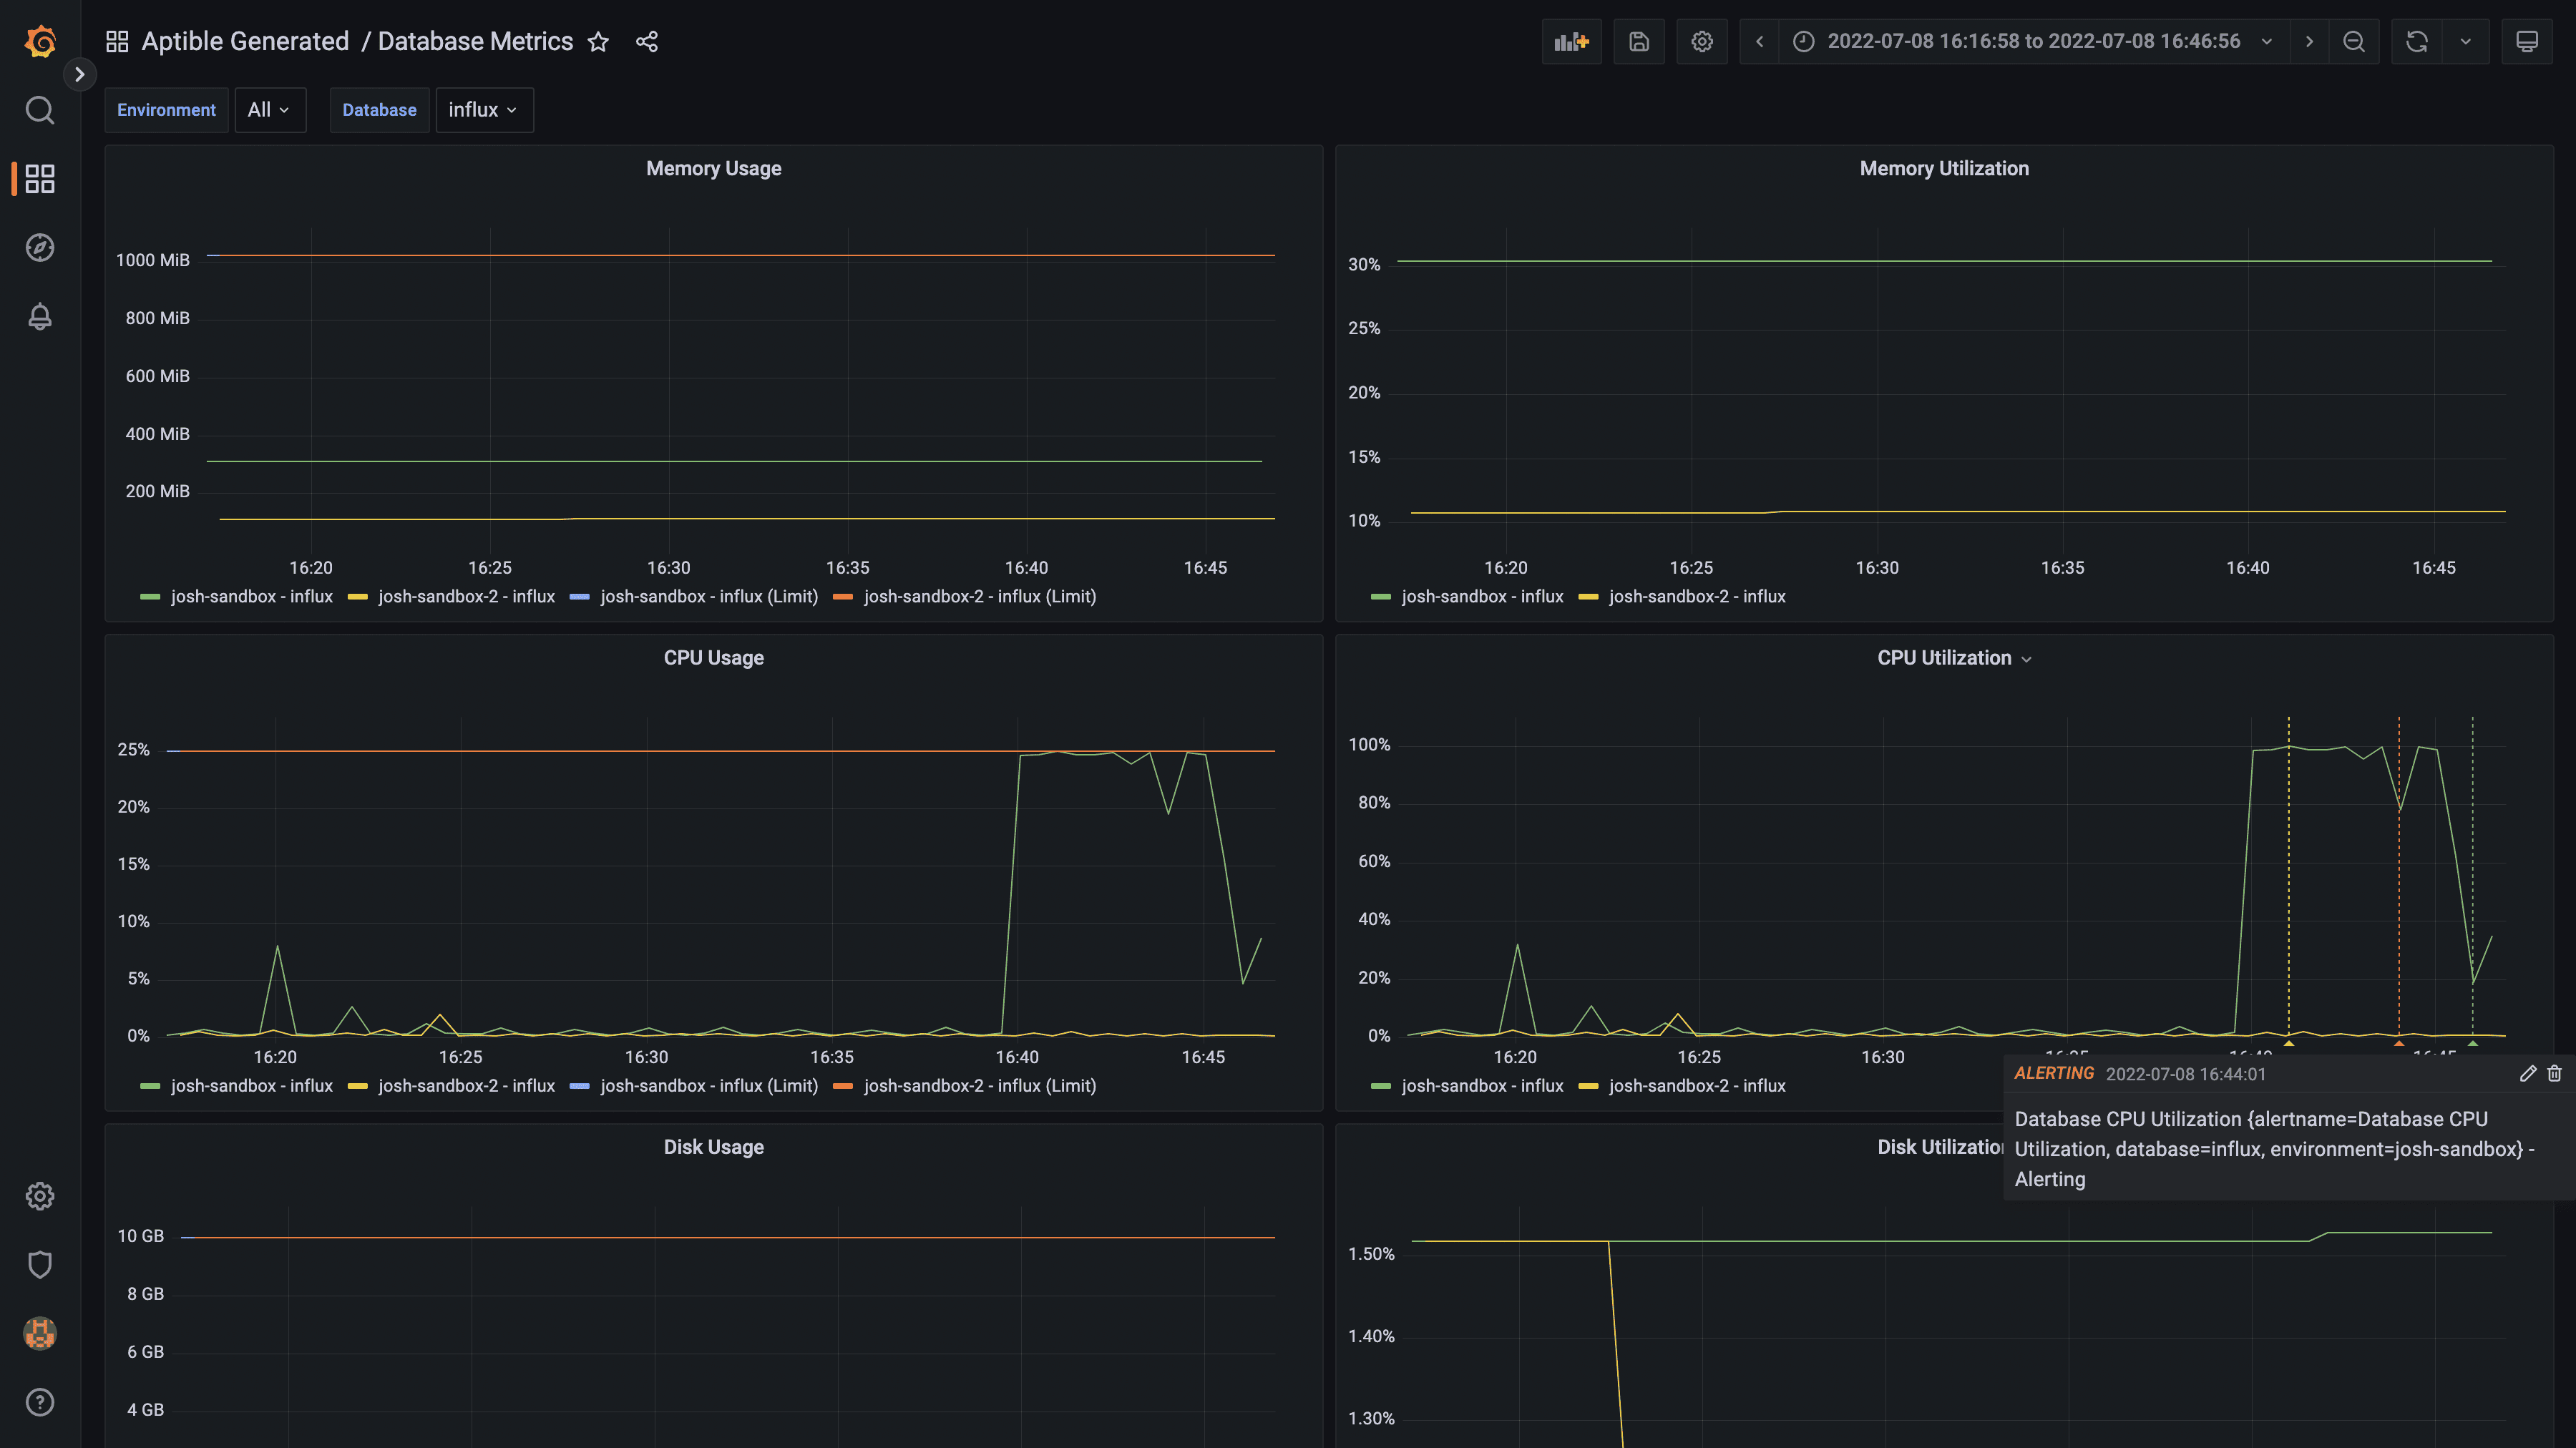
Database metrics in the pre-built Grafana dashboard
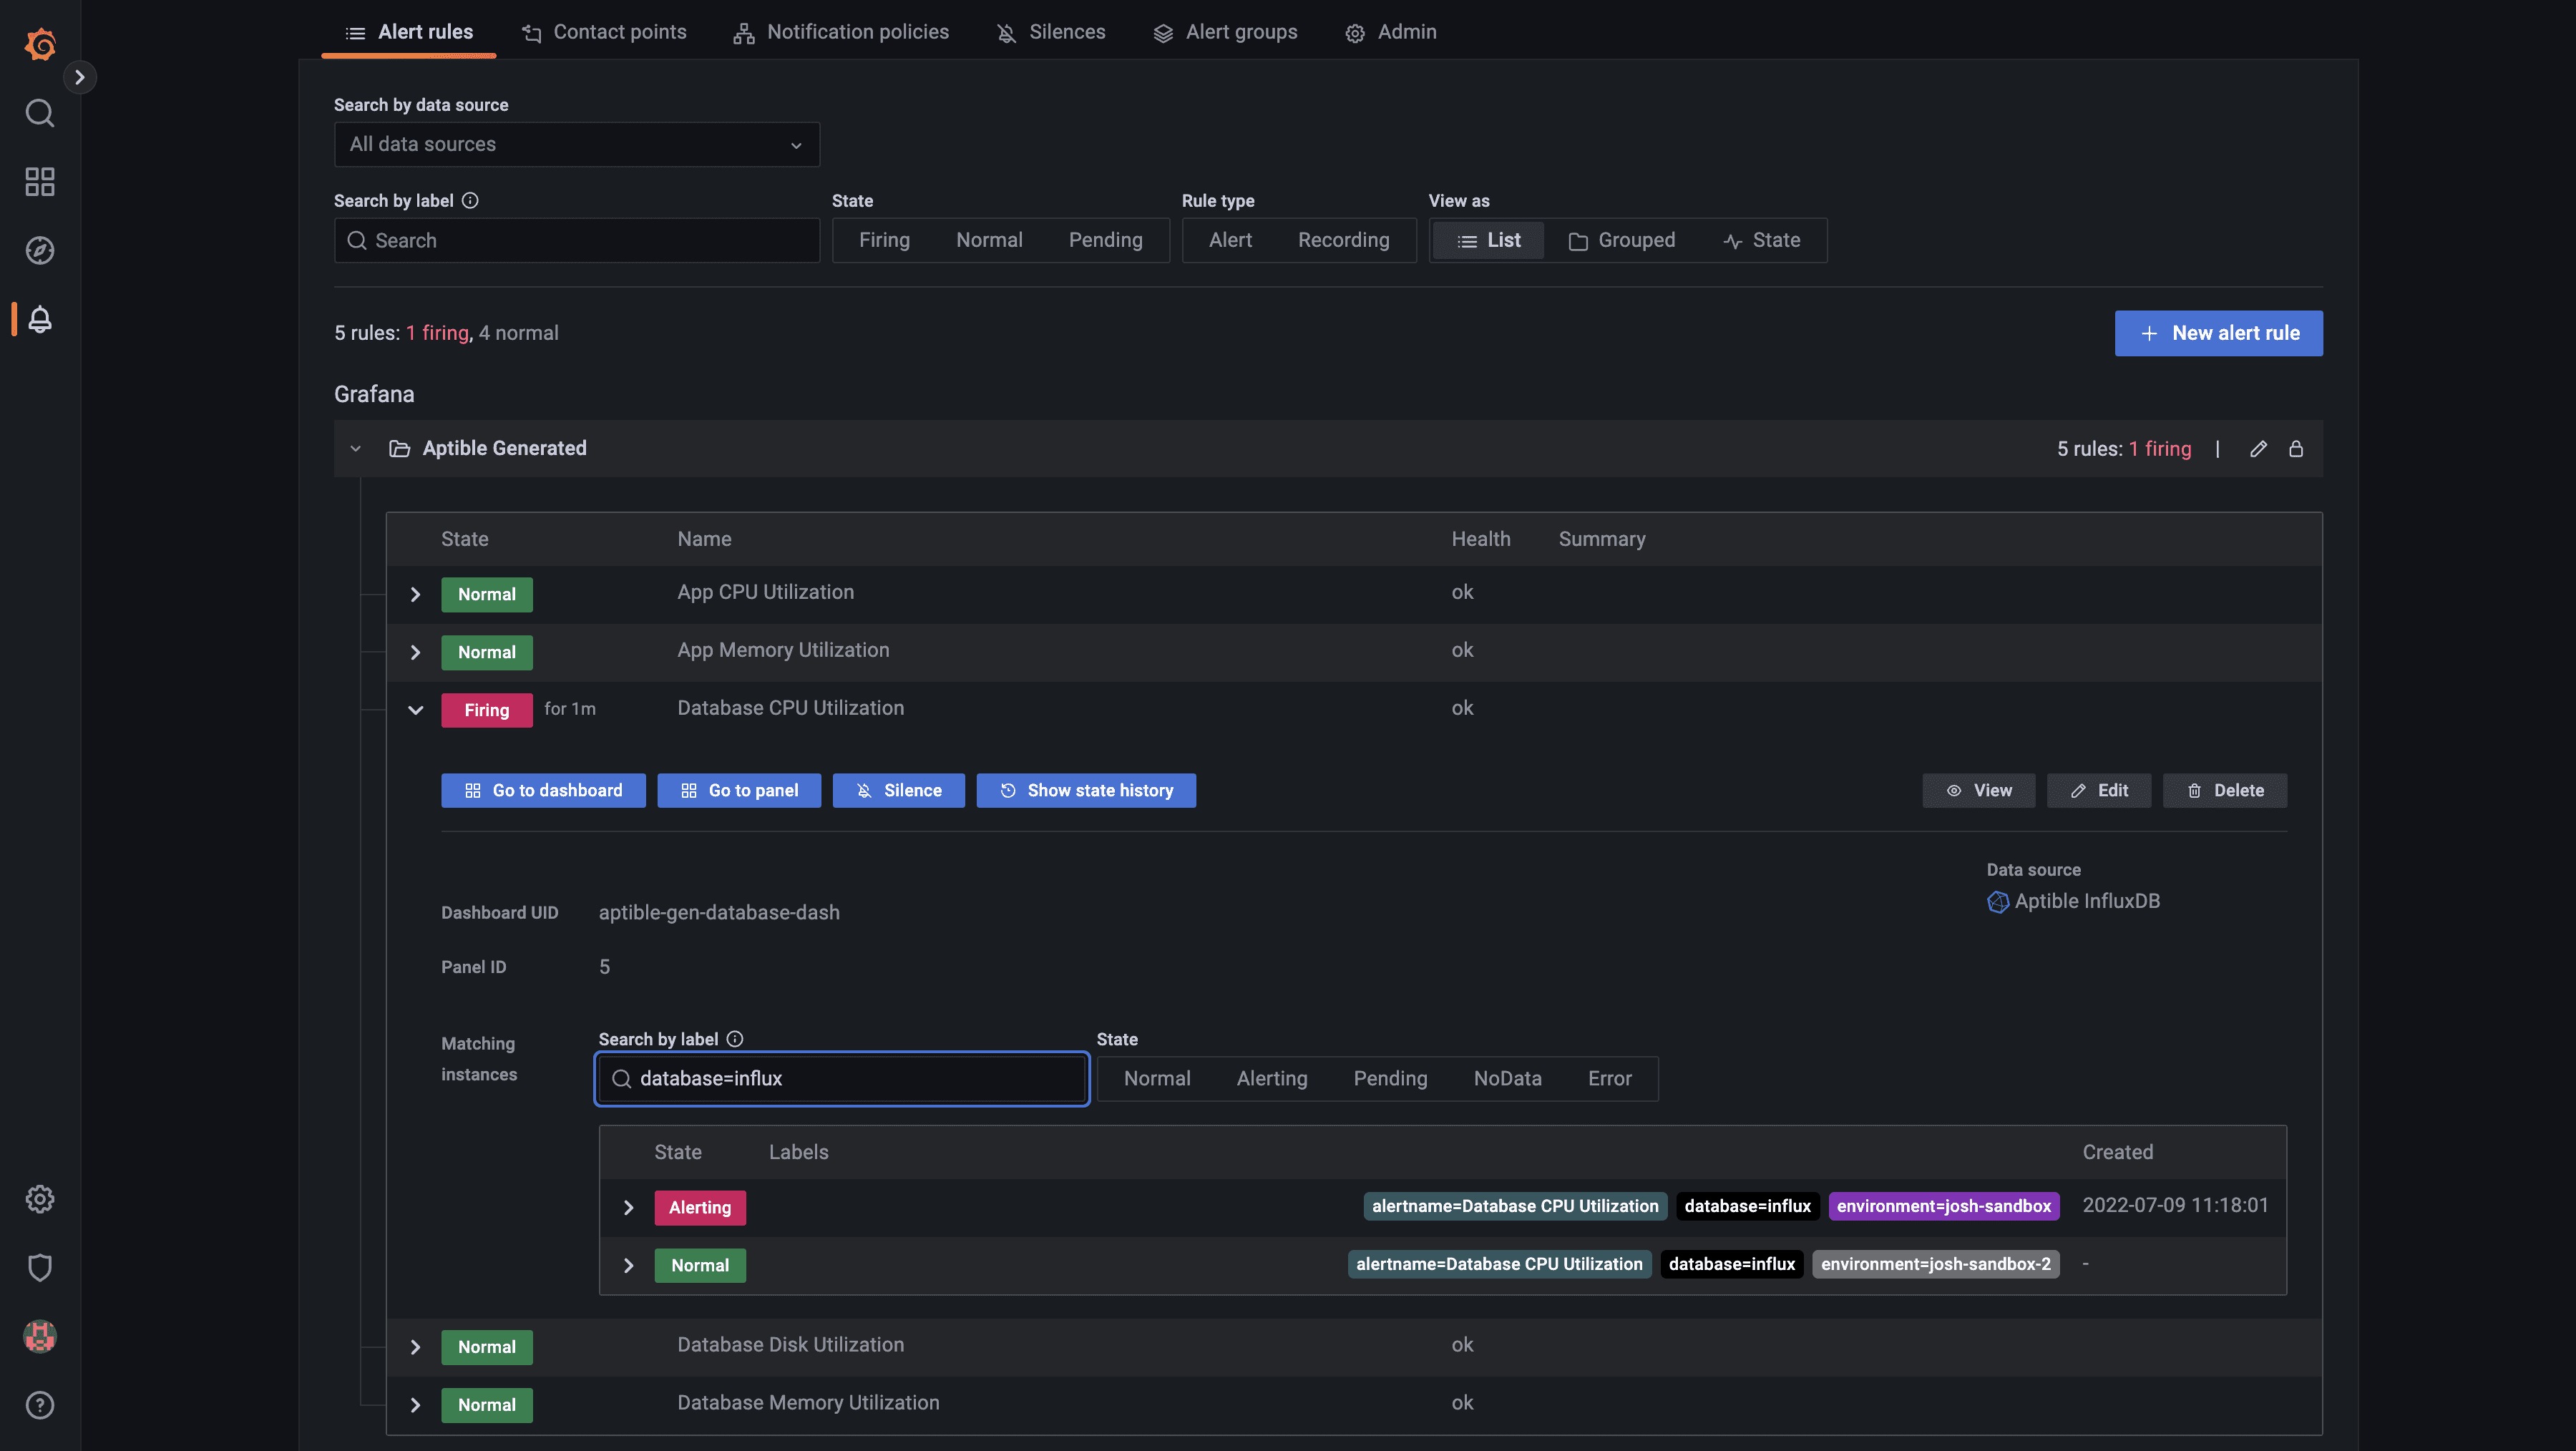
Alert rules in the pre-built Grafana dashboard
aptible_metric_drain resources can now be managed through Terraform. Learn more here about resource attributes and configuration.
Pre-built Grafana dashboards and alerting You can now use the aptible/metrics Terraform module to provision Metric Drains with pre-built Grafana dashboards and alerts for monitoring RAM & CPU usage for your Apps & Databases. This simplifies the setup of Metric Drains so you can start monitoring your Aptible resources immediately, all hosted within your Aptible account!
App metrics in the pre-built Grafana dashboard
Database metrics in the pre-built Grafana dashboard
Alert rules in the pre-built Grafana dashboard
Oct 25, 2022
Oct 25, 2022
aptible_metric_drain resources can now be managed through Terraform. Learn more here about resource attributes and configuration.
Pre-built Grafana dashboards and alerting You can now use the aptible/metrics Terraform module to provision Metric Drains with pre-built Grafana dashboards and alerts for monitoring RAM & CPU usage for your Apps & Databases. This simplifies the setup of Metric Drains so you can start monitoring your Aptible resources immediately, all hosted within your Aptible account!
App metrics in the pre-built Grafana dashboard
Database metrics in the pre-built Grafana dashboard
Alert rules in the pre-built Grafana dashboard
Oct 25, 2022
Sep 30, 2022
With our new S3 Log Archiving functionality, you can now configure log archiving to an Amazon S3 bucket owned by you! This feature is designed to be an important complement to Log Drains, so you can retain logs for compliance in the event your primary logging provider experiences delivery or availability issues.
By sending these files to an S3 bucket owned by you, you have the flexibility to set retention policies as needed - with the security of knowing your data is encrypted in transit and at rest. Decryption is handled automatically upon retrieval via the Aptible CLI.
Learn more about setting up S3 Log Archiving. When you're ready to finalize the setup, contact Aptible Support and provide the following information:
Your AWS Account ID
The name of your S3 bucket to use for archiving
Sep 30, 2022
Sep 30, 2022
With our new S3 Log Archiving functionality, you can now configure log archiving to an Amazon S3 bucket owned by you! This feature is designed to be an important complement to Log Drains, so you can retain logs for compliance in the event your primary logging provider experiences delivery or availability issues.
By sending these files to an S3 bucket owned by you, you have the flexibility to set retention policies as needed - with the security of knowing your data is encrypted in transit and at rest. Decryption is handled automatically upon retrieval via the Aptible CLI.
Learn more about setting up S3 Log Archiving. When you're ready to finalize the setup, contact Aptible Support and provide the following information:
Your AWS Account ID
The name of your S3 bucket to use for archiving
Sep 30, 2022
Sep 29, 2022
You can now manage aptible_log_drain resources through our Terraform Provider. Learn more here about resource attributes and configuration.
Terraform Endpoint Bug Fix Feedback suggested by the Terraform Provider claimed that Endpoint placement could change (e.g. external to internal) but it cannot without a destructive operation (e.g. destroy and recreate).ForceNew now occurs on Endpoint placement changes in the Aptible Terraform Provider. This will result in an Endpoint being destroyed and then recreated.
Sep 29, 2022
Sep 29, 2022
You can now manage aptible_log_drain resources through our Terraform Provider. Learn more here about resource attributes and configuration.
Terraform Endpoint Bug Fix Feedback suggested by the Terraform Provider claimed that Endpoint placement could change (e.g. external to internal) but it cannot without a destructive operation (e.g. destroy and recreate).ForceNew now occurs on Endpoint placement changes in the Aptible Terraform Provider. This will result in an Endpoint being destroyed and then recreated.
Sep 29, 2022
Sep 26, 2022
We've updated the Aptible Dashboard, so all supported Disk and Container sizes are available for scaling. Previously, the Aptible CLI supported more scaling sizes than the Aptible Dashboard.
New Renaming Commands You can now rename apps, databases, and environments via the Aptible CLI using these new commands:
aptible environment:rename Learn more
aptible app:rename Learn more
aptible database:rename Learn more
Previously, this could only be done by the Aptible Support team.
Improved Terraform Error Messages The Aptible Terraform provider will now return more informative error messages from the server (for example, validation errors or other informative errors the Aptible backend may return) with a status code and message. Previously, errors were unclear by pointers returned by the client, making it impossible to read the backend errors themselves with no status code or message.
Sep 26, 2022
Sep 26, 2022
We've updated the Aptible Dashboard, so all supported Disk and Container sizes are available for scaling. Previously, the Aptible CLI supported more scaling sizes than the Aptible Dashboard.
New Renaming Commands You can now rename apps, databases, and environments via the Aptible CLI using these new commands:
aptible environment:rename Learn more
aptible app:rename Learn more
aptible database:rename Learn more
Previously, this could only be done by the Aptible Support team.
Improved Terraform Error Messages The Aptible Terraform provider will now return more informative error messages from the server (for example, validation errors or other informative errors the Aptible backend may return) with a status code and message. Previously, errors were unclear by pointers returned by the client, making it impossible to read the backend errors themselves with no status code or message.
Sep 26, 2022
Sep 9, 2022
Prior to today, operation logs could only be accessed in real-time via the Aptible CLI, while an operation was running. This made debugging difficult in a number of scenarios:
Terraform operations, for which logs are not captured
CI-initiated jobs disconnected due to a CI service issue
Manual operations inadvertently disconnected via Ctrl-C
Manual operations initiated from the Aptible Dashboard
Today, we have released support for downloading logs for completed operations from the Aptible Dashboard or CLI, and also for attaching to real-time logs via Aptible CLI by providing the operation ID.
When you navigate to an App or Database in the Aptible Dashboard and view the Activity tab for that resource, you'll see a log download icon to the right of the timestamp:

Using the Aptible CLI, you can follow the logs of a running operation:
aptible operation:follow OPERATION_ID
...and view the logs for a completed operation:
aptible operation:logs OPERATION_ID
Prior to today, operation logs could only be accessed in real-time via the Aptible CLI, while an operation was running. This made debugging difficult in a number of scenarios:
Terraform operations, for which logs are not captured
CI-initiated jobs disconnected due to a CI service issue
Manual operations inadvertently disconnected via Ctrl-C
Manual operations initiated from the Aptible Dashboard
Today, we have released support for downloading logs for completed operations from the Aptible Dashboard or CLI, and also for attaching to real-time logs via Aptible CLI by providing the operation ID.
When you navigate to an App or Database in the Aptible Dashboard and view the Activity tab for that resource, you'll see a log download icon to the right of the timestamp:
Using the Aptible CLI, you can follow the logs of a running operation:
aptible operation:follow OPERATION_ID
...and view the logs for a completed operation:
aptible operation:logs OPERATION_ID
Sep 9, 2022
Sep 9, 2022
Prior to today, operation logs could only be accessed in real-time via the Aptible CLI, while an operation was running. This made debugging difficult in a number of scenarios:
Terraform operations, for which logs are not captured
CI-initiated jobs disconnected due to a CI service issue
Manual operations inadvertently disconnected via Ctrl-C
Manual operations initiated from the Aptible Dashboard
Today, we have released support for downloading logs for completed operations from the Aptible Dashboard or CLI, and also for attaching to real-time logs via Aptible CLI by providing the operation ID.
When you navigate to an App or Database in the Aptible Dashboard and view the Activity tab for that resource, you'll see a log download icon to the right of the timestamp:
Using the Aptible CLI, you can follow the logs of a running operation:
aptible operation:follow OPERATION_ID
...and view the logs for a completed operation:
aptible operation:logs OPERATION_ID
Sep 9, 2022
Aug 31, 2022
These can be set with APTIBLE_USERNAME and APTIBLE_PASSWORD environment variables. Learn more here.
Rename App and Database handles To change a handle for an existing resource, simply change the string passed into the handle field for a given Database or App and the change will reflect within Aptible (both UI and CLI). The affected fields are the app handle and database handle.
Aug 31, 2022
Aug 31, 2022
These can be set with APTIBLE_USERNAME and APTIBLE_PASSWORD environment variables. Learn more here.
Rename App and Database handles To change a handle for an existing resource, simply change the string passed into the handle field for a given Database or App and the change will reflect within Aptible (both UI and CLI). The affected fields are the app handle and database handle.
Aug 31, 2022
Aug 9, 2022
We are excited to share Aptible's underlying container scheduler has been radically improved. New EC2 instances provisioned during releases and scaling operations are now quicker and more reliable. Operations that previously took 15+ minutes to launch new EC2 instances will now take less than 3 minutes for the same process (x5 times faster)!
We are excited to share Aptible's underlying container scheduler has been radically improved. New EC2 instances provisioned during releases and scaling operations are now quicker and more reliable. Operations that previously took 15+ minutes to launch new EC2 instances will now take less than 3 minutes for the same process (x5 times faster)!
Aug 9, 2022
Aug 9, 2022
We are excited to share Aptible's underlying container scheduler has been radically improved. New EC2 instances provisioned during releases and scaling operations are now quicker and more reliable. Operations that previously took 15+ minutes to launch new EC2 instances will now take less than 3 minutes for the same process (x5 times faster)!
We are excited to share Aptible's underlying container scheduler has been radically improved. New EC2 instances provisioned during releases and scaling operations are now quicker and more reliable. Operations that previously took 15+ minutes to launch new EC2 instances will now take less than 3 minutes for the same process (x5 times faster)!
Aug 9, 2022
Jul 22, 2022
We are excited to announce that Container Profiles and Enforced Resource Allocation are now generally available on Aptible. By default, new Dedicated Stacks and all Shared Stacks have Enforced Resource Allocation enabled—meaning CPU Limits and Memory Limits are enabled and enforced for each container.
The new Container Profiles can be found under the Scale menu of your Aptible dashboard, for stacks with Enforced Resource Allocation enabled.
These improvements include new Container Profiles with different CPU to RAM ratios and a range of supported Container sizes, helping you to optimize your costs for different applications. The three types of Container Profiles currently available are as follows:
General Purpose: The default Container Profile, which works well for most use cases.
CPU Optimized: For CPU-constrained workloads, this profile provides high-performance CPUs and more CPU per GB of RAM.
Memory Optimized: For memory-constrained workloads, this profile provides more RAM for each CPU allocated to the container.
Aptible strongly recommends enabling Enforced Resource Allocation on existing Dedicated Stacks which don't currently enforce CPU Limits. Check out our FAQ on CPU Limits for more information about Enforced Resource Allocation!
Jul 22, 2022
Jul 22, 2022
We are excited to announce that Container Profiles and Enforced Resource Allocation are now generally available on Aptible. By default, new Dedicated Stacks and all Shared Stacks have Enforced Resource Allocation enabled—meaning CPU Limits and Memory Limits are enabled and enforced for each container.
The new Container Profiles can be found under the Scale menu of your Aptible dashboard, for stacks with Enforced Resource Allocation enabled.
These improvements include new Container Profiles with different CPU to RAM ratios and a range of supported Container sizes, helping you to optimize your costs for different applications. The three types of Container Profiles currently available are as follows:
General Purpose: The default Container Profile, which works well for most use cases.
CPU Optimized: For CPU-constrained workloads, this profile provides high-performance CPUs and more CPU per GB of RAM.
Memory Optimized: For memory-constrained workloads, this profile provides more RAM for each CPU allocated to the container.
Aptible strongly recommends enabling Enforced Resource Allocation on existing Dedicated Stacks which don't currently enforce CPU Limits. Check out our FAQ on CPU Limits for more information about Enforced Resource Allocation!
Jul 22, 2022
Jul 20, 2022
We have released support for additional Redis and Postgres versions. Aptible Deploy is now compatible with Redis 6 and 7 and Postgres 9.6.24, 10.21, 11.16, 12.11, 13.7, and 14.4.
Improved Deploy Times We have fixed a bug that was causing builds to miss the cache more frequently than they should, thereby increasing deploy times. A new release should make it more likely that builds will hit the cache.
If the build continues to be a pain point, we recommend switching to Direct Docker Image Deployment to gain full control over the build process.
Jul 20, 2022
Jul 20, 2022
We have released support for additional Redis and Postgres versions. Aptible Deploy is now compatible with Redis 6 and 7 and Postgres 9.6.24, 10.21, 11.16, 12.11, 13.7, and 14.4.
Improved Deploy Times We have fixed a bug that was causing builds to miss the cache more frequently than they should, thereby increasing deploy times. A new release should make it more likely that builds will hit the cache.
If the build continues to be a pain point, we recommend switching to Direct Docker Image Deployment to gain full control over the build process.
Jul 20, 2022
Feb 15, 2022
We are thrilled to announce that Single Sign-On (SSO) is now available on all Aptible infrastructure at no additional cost. Formerly, this was only available to Enterprise customers.
With SSO, you can allow users of your organization to log in to Aptible using a SAML-based identity provider like Okta and GSuite.
Feb 15, 2022
Feb 15, 2022
We are thrilled to announce that Single Sign-On (SSO) is now available on all Aptible infrastructure at no additional cost. Formerly, this was only available to Enterprise customers.
With SSO, you can allow users of your organization to log in to Aptible using a SAML-based identity provider like Okta and GSuite.
Feb 15, 2022
Nov 1, 2021
We've added small improvements to the end user experience when setting up Log Drains, and when scaling Services.
Scaling Services
Clicking Scale in a Service now shows a "drawer" with options shown to horizontally or vertically scale your services. The Metrics tab in the drawer allows you to quickly navigate to Container Service metrics to make better informed scaling decisions.
Outside of the drawer experience, the key change is the ability to vertically scale your services to every possible size right up to the instance's maximum allowed limit in the UI. Previously, scaling beyond 7 GB this was only possible through the CLI. In addition, we've made it possible for you to see the CPU share per container based on the enforcements of CPU limits for better predictability in performance.
Setting up Log Drains
While the experience to set up Log Drains is still the same, minor improvements where made to the overall visual design.
Nov 1, 2021
Nov 1, 2021
We've added small improvements to the end user experience when setting up Log Drains, and when scaling Services.
Scaling Services
Clicking Scale in a Service now shows a "drawer" with options shown to horizontally or vertically scale your services. The Metrics tab in the drawer allows you to quickly navigate to Container Service metrics to make better informed scaling decisions.
Outside of the drawer experience, the key change is the ability to vertically scale your services to every possible size right up to the instance's maximum allowed limit in the UI. Previously, scaling beyond 7 GB this was only possible through the CLI. In addition, we've made it possible for you to see the CPU share per container based on the enforcements of CPU limits for better predictability in performance.
Setting up Log Drains
While the experience to set up Log Drains is still the same, minor improvements where made to the overall visual design.
Nov 1, 2021
Nov 1, 2021
Docker images are an essential component for building containers because they serve as the base of a container. Dockerfiles – lists of instructions that are automatically executed - are written to create specific Docker images. Avoiding large images speeds up the build and deployment of containers, thus contributing positively to your DevOps performance metrics.
Keeping image sizes low can prove challenging. Each instruction in the Dockerfile adds one additional layer to the image, contributing to the size of the image. Shell tricks had to be otherwise employed to write a clean, efficient Dockerfile and to ensure that each layer has the artifacts it needs from the previous layer and nothing else, all of which takes effort and creativity, in addition to being error prone. It was also not uncommon to have separate Dockerfiles for development and a slimmed down version for production, commonly referred to as the "builder pattern". Maintaining multiple Dockerfiles for the same project is not ideal as it could produce different results between development and production, making software development, testing and bug fixes unreliable when pushing new code.
Docker introduced multi-stage builds to solve for the above, which Aptible now supports when using Dockerfile Deploys. Please note that users deploying using the Direct Docker Image Deployment method on Aptible could have used multi-stage builds prior to this release.
Using multi-stage builds
With multi-stage builds, you use multiple FROM statements in your Dockerfile. Each FROM instruction can use a different base, and each of them begins a new stage of the build. You can selectively copy artifacts from one stage to another, leaving behind everything you don’t want in the final image.
You can learn more about how to use the FROM instructional statements, naming different build stages in your Dockerfile, picking up from when a previous stage was left off, and more here.
Nov 1, 2021
Nov 1, 2021
Docker images are an essential component for building containers because they serve as the base of a container. Dockerfiles – lists of instructions that are automatically executed - are written to create specific Docker images. Avoiding large images speeds up the build and deployment of containers, thus contributing positively to your DevOps performance metrics.
Keeping image sizes low can prove challenging. Each instruction in the Dockerfile adds one additional layer to the image, contributing to the size of the image. Shell tricks had to be otherwise employed to write a clean, efficient Dockerfile and to ensure that each layer has the artifacts it needs from the previous layer and nothing else, all of which takes effort and creativity, in addition to being error prone. It was also not uncommon to have separate Dockerfiles for development and a slimmed down version for production, commonly referred to as the "builder pattern". Maintaining multiple Dockerfiles for the same project is not ideal as it could produce different results between development and production, making software development, testing and bug fixes unreliable when pushing new code.
Docker introduced multi-stage builds to solve for the above, which Aptible now supports when using Dockerfile Deploys. Please note that users deploying using the Direct Docker Image Deployment method on Aptible could have used multi-stage builds prior to this release.
Using multi-stage builds
With multi-stage builds, you use multiple FROM statements in your Dockerfile. Each FROM instruction can use a different base, and each of them begins a new stage of the build. You can selectively copy artifacts from one stage to another, leaving behind everything you don’t want in the final image.
You can learn more about how to use the FROM instructional statements, naming different build stages in your Dockerfile, picking up from when a previous stage was left off, and more here.
Nov 1, 2021
Oct 8, 2021
Over the years, the Aptible product teams have learned that a vast number of teams would benefit from not just having greater visibility into the security safeguards Aptible has in place across different aspects of the infrastructure, but also get insights to understand what they need to do to further improve their posture to reach a compliance goal.
To help with this, we’re excited to be announcing the newest Aptible feature - the Compliance Visibility Dashboard!
The Compliance Visibility Dashboard provides a unified view of all the technical security controls in place that Aptible fully enforces and manages on your behalf, as well as security configurations you have controls over in the platform.
Think of security controls as safeguards implemented to protect various forms of data and infrastructure, important both for compliance satisfaction as well as best-practice security.
Video explaining how the Dashboard works.
With this feature, you can not only see in detail the many infrastructure security controls Aptible automatically enforces on you behalf, but also get actionable recommendations around safeguards you can configure on the platform (for example, enabling cross-region backup creation) to improve you overall security posture and accelerate compliance with frameworks like HIPAA and HITRUST. Apart from being visualized in the main Aptible Dashboard, these controls along with their descriptions can be exported as a print-friendly PDF for sharing externally with prospects and auditors to gain their trust and confidence faster.
You can access the Compliance Visibility Dashboard by clicking on the Security & Compliance tab in the navigation bar.
Here’s documentation to learn more about using the Dashboard in greater detail.
Oct 8, 2021
Oct 8, 2021
Over the years, the Aptible product teams have learned that a vast number of teams would benefit from not just having greater visibility into the security safeguards Aptible has in place across different aspects of the infrastructure, but also get insights to understand what they need to do to further improve their posture to reach a compliance goal.
To help with this, we’re excited to be announcing the newest Aptible feature - the Compliance Visibility Dashboard!
The Compliance Visibility Dashboard provides a unified view of all the technical security controls in place that Aptible fully enforces and manages on your behalf, as well as security configurations you have controls over in the platform.
Think of security controls as safeguards implemented to protect various forms of data and infrastructure, important both for compliance satisfaction as well as best-practice security.
Video explaining how the Dashboard works.
With this feature, you can not only see in detail the many infrastructure security controls Aptible automatically enforces on you behalf, but also get actionable recommendations around safeguards you can configure on the platform (for example, enabling cross-region backup creation) to improve you overall security posture and accelerate compliance with frameworks like HIPAA and HITRUST. Apart from being visualized in the main Aptible Dashboard, these controls along with their descriptions can be exported as a print-friendly PDF for sharing externally with prospects and auditors to gain their trust and confidence faster.
You can access the Compliance Visibility Dashboard by clicking on the Security & Compliance tab in the navigation bar.
Here’s documentation to learn more about using the Dashboard in greater detail.
Oct 8, 2021
Sep 9, 2021
Broadly speaking, two levels of access can be granted to Users through Aptible Roles on a per-Environments basis
Manage Access: Provides Users with full read and write permissions on all resources in a particular Environment.
Read Access: Provides Users with read-only access to all resources in an Environment, including App configuration and Database credentials.
While Users with read access are not allowed to make any changes, or create Ephemeral SSH Sessions or Database Tunnels, they were still able to view credentials of their Aptible-managed Databases. This was possible either through the Database dashboard or through the CLI with the [aptible db:url] and the APTIBLE_OUTPUT_FORMAT=json aptible db:list commands.
For heightened security, Users with read access can no longer see Database Credentials, both in the UI or through the CLI.
Now, when clicking Reveal in the Database dashboard, read access Users will see a pop-up window that does not reveal the connection URL for the said database.
The same is true in the CLI.
When using the aptible db:url HANDLE command in the CLI, Users with read access will see the following message that no longe reveals the Database connection URL.
No default credential for database, valid credential types:
When using the APTIBLE_OUTPUT_FORMAT=json aptible db:list command, read access Users will see empty values for their Database connection URL and credentials.
Note: If your teams have passed the Database connection URL as an environment variable, Users with read access can still read this set configuration.
Sep 9, 2021
Sep 9, 2021
Broadly speaking, two levels of access can be granted to Users through Aptible Roles on a per-Environments basis
Manage Access: Provides Users with full read and write permissions on all resources in a particular Environment.
Read Access: Provides Users with read-only access to all resources in an Environment, including App configuration and Database credentials.
While Users with read access are not allowed to make any changes, or create Ephemeral SSH Sessions or Database Tunnels, they were still able to view credentials of their Aptible-managed Databases. This was possible either through the Database dashboard or through the CLI with the [aptible db:url] and the APTIBLE_OUTPUT_FORMAT=json aptible db:list commands.
For heightened security, Users with read access can no longer see Database Credentials, both in the UI or through the CLI.
Now, when clicking Reveal in the Database dashboard, read access Users will see a pop-up window that does not reveal the connection URL for the said database.
The same is true in the CLI.
When using the aptible db:url HANDLE command in the CLI, Users with read access will see the following message that no longe reveals the Database connection URL.
No default credential for database, valid credential types:
When using the APTIBLE_OUTPUT_FORMAT=json aptible db:list command, read access Users will see empty values for their Database connection URL and credentials.
Note: If your teams have passed the Database connection URL as an environment variable, Users with read access can still read this set configuration.
Sep 9, 2021
Aug 3, 2021
We've released the newest version of the Aptible CLI - v0.19.1 that adds more command line functionality to help you better automate management of Log Drains, Metric Drains and Database Endpoints.
Provisioning and managing Log Drains
Aptible users could provision and manage Log Drains on the dashboard to send their container output, endpoint requests and errors, and SSH session activity to external logging destinations for aggregation, analysis and record keeping.
This new update allows you to also do the same through the CLI.
You can create new Log Drains using the aptible log_drain:create command, with additional options to configure drain destinations and the kind of activity and output you want to capture and send. For example, to create and configure a new Log Drain with Sumologic as the destination, you'd use the following command.
cURLaptible log_drain:create:sumologic HANDLE --url SUMOLOGIC_URL --environment ENVIRONMENT \ [--drain-apps true/false] [--drain_databases true/false] \ [--drain_ephemeral_sessions true/false] [--drain_proxies true/false]
Options: [--url=URL] [--drain-apps], [--no-drain-apps] # Default: true [--drain-databases], [--no-drain-databases] # Default: true [--drain-ephemeral-sessions], [--no-drain-ephemeral-sessions] # Default: true [--drain-proxies], [--no-drain-proxies] # Default: true [--environment=ENVIRONMENT]
Just like with Sumologic, you can provision new Log Drains to Datadog, LogDNA, Papertrail, self-hosted Elasticsearch or to HTTPS and Syslog destinations of your choice.
We've also added supporting features to help your teams see the list of provisioned Log Drains using the aptible log_drain:list command and deprovision any of them with aptible log_drain:deprovision.
Provisioning and managing Metric Drains
Like with Log Drains, you can now add new Metric Drains or manage existing ones through the CLI. Metric Drains allow you to send container performance metrics like disc IOPS, memory and CPU usage to metric aggregators like Datadog for reporting and alerting purposes.
You can create new Metric Drains using the aptible metric_drain:create command. With this, you can send the needed metrics to Datadog, InfluxDB hosted on Aptible, or an InfluxDB hosted anywhere else.
You can also see a list of Metric Drains created in your account using the aptible metric_drain:list command, or deprovision any of them with aptible metric_drain:deprovision .
Managing Database Endpoints
The primary configuration with regards to managing existing Database Endpoints is IP filtering. Just like App Endpoints, Database Endpoints support IP filtering to restrict connections to your database to a set of pre-approved IP addresses. While this was always managed through the UI, the latest CLI update lets you manage IP filters for already provisioned Database Endpoints using the aptible endpoints:database:modify command.
cURLaptible endpoints:database:modify --database DATABASE ENDPOINT_HOSTNAME
Options: [--environment=ENVIRONMENT] [--database=DATABASE] [--ip-whitelist=one two three] # A list of IPv4 sources (addresses or CIDRs) to which to restrict traffic to this Endpoint [--no-ip-whitelist] # Disable IP Whitelist
Download the latest version of the CLI today!
Aug 3, 2021
Aug 3, 2021
We've released the newest version of the Aptible CLI - v0.19.1 that adds more command line functionality to help you better automate management of Log Drains, Metric Drains and Database Endpoints.
Provisioning and managing Log Drains
Aptible users could provision and manage Log Drains on the dashboard to send their container output, endpoint requests and errors, and SSH session activity to external logging destinations for aggregation, analysis and record keeping.
This new update allows you to also do the same through the CLI.
You can create new Log Drains using the aptible log_drain:create command, with additional options to configure drain destinations and the kind of activity and output you want to capture and send. For example, to create and configure a new Log Drain with Sumologic as the destination, you'd use the following command.
cURLaptible log_drain:create:sumologic HANDLE --url SUMOLOGIC_URL --environment ENVIRONMENT \ [--drain-apps true/false] [--drain_databases true/false] \ [--drain_ephemeral_sessions true/false] [--drain_proxies true/false]
Options: [--url=URL] [--drain-apps], [--no-drain-apps] # Default: true [--drain-databases], [--no-drain-databases] # Default: true [--drain-ephemeral-sessions], [--no-drain-ephemeral-sessions] # Default: true [--drain-proxies], [--no-drain-proxies] # Default: true [--environment=ENVIRONMENT]
Just like with Sumologic, you can provision new Log Drains to Datadog, LogDNA, Papertrail, self-hosted Elasticsearch or to HTTPS and Syslog destinations of your choice.
We've also added supporting features to help your teams see the list of provisioned Log Drains using the aptible log_drain:list command and deprovision any of them with aptible log_drain:deprovision.
Provisioning and managing Metric Drains
Like with Log Drains, you can now add new Metric Drains or manage existing ones through the CLI. Metric Drains allow you to send container performance metrics like disc IOPS, memory and CPU usage to metric aggregators like Datadog for reporting and alerting purposes.
You can create new Metric Drains using the aptible metric_drain:create command. With this, you can send the needed metrics to Datadog, InfluxDB hosted on Aptible, or an InfluxDB hosted anywhere else.
You can also see a list of Metric Drains created in your account using the aptible metric_drain:list command, or deprovision any of them with aptible metric_drain:deprovision .
Managing Database Endpoints
The primary configuration with regards to managing existing Database Endpoints is IP filtering. Just like App Endpoints, Database Endpoints support IP filtering to restrict connections to your database to a set of pre-approved IP addresses. While this was always managed through the UI, the latest CLI update lets you manage IP filters for already provisioned Database Endpoints using the aptible endpoints:database:modify command.
cURLaptible endpoints:database:modify --database DATABASE ENDPOINT_HOSTNAME
Options: [--environment=ENVIRONMENT] [--database=DATABASE] [--ip-whitelist=one two three] # A list of IPv4 sources (addresses or CIDRs) to which to restrict traffic to this Endpoint [--no-ip-whitelist] # Disable IP Whitelist
Download the latest version of the CLI today!
Aug 3, 2021
Jun 29, 2021
Aptible Deploy has always allowed developers to trigger a backup, something we call a manual backup.
To allow you to quickly see who in your team triggered the database backup and help with any reviews, we've now added a created by field in the Backups tab of your databases in the Aptible dashboard.
You can also see the equivalent of this through the CLI using the aptible backup:list command. Please make sure you're on version 0.18.3 or higher of the CLI.
Jun 29, 2021
Jun 29, 2021
Aptible Deploy has always allowed developers to trigger a backup, something we call a manual backup.
To allow you to quickly see who in your team triggered the database backup and help with any reviews, we've now added a created by field in the Backups tab of your databases in the Aptible dashboard.
You can also see the equivalent of this through the CLI using the aptible backup:list command. Please make sure you're on version 0.18.3 or higher of the CLI.
Jun 29, 2021
Jun 17, 2021
Aptible Deploy comes with built-in support for easily aggregating your container, SSH session and HTTP(S) endpoint logs and routing them to your destinations of choice for record-keeping and future analysis, be it in popular external destinations like Datadog, SumoLogic and PaperTrail, or to a self-hosted Elasticsearch database.
Since 2014, Aptible log drains have been used by customers to send hundreds of millions of log lines to various destinations. While the majority of our customers were able to aggregate their logs without hiccup, we also heard a few of them experience issues when the volume of logs being generated were extremely high. These issues ranged from inconvenient delays in receiving logs in their destinations to packet losses during periods of high throughput.
So we decided to fix this by engineering and releasing a new version of Aptible log drains.
What customers can expect with this new version of log drains
The log drains of all Aptible accounts have been updated to the latest version, requiring no additional setup from customers. Customers can expect the following from the latest version.
Improved performance With this update, users can see a noticeable improvement in the reliability and speed of their log drains. Customers may experience minimal to no lag when generating and sending their logs, even at very high volumes due to the work we put in to increase throughput in the new version of our drains.
Better internal observability for faster remediation Using a combination of FluentD data, and visualizing and graphing this data into metrics of importance in Grafana, we’ve been able to set up alerts to monitor for issues based on the the the number of logs waiting to be sent , the number of times customer drains retry sending logs, failed output writes to different destinations, and others. We believe these metrics allow our reliability engineers to quickly identify root-causes, be it on Aptible’s side or the customer's side as issues arise, and remediate them more efficiently.
Over time, we’ll evolve these metrics as we learn how our newest version of log drains performs in a wider variety of real world scenarios. Depending on how well these metrics perform, we may also choose to expose them to customers to enable more proactive, self-service remediation of log drain issues.
Jun 17, 2021
Jun 17, 2021
Aptible Deploy comes with built-in support for easily aggregating your container, SSH session and HTTP(S) endpoint logs and routing them to your destinations of choice for record-keeping and future analysis, be it in popular external destinations like Datadog, SumoLogic and PaperTrail, or to a self-hosted Elasticsearch database.
Since 2014, Aptible log drains have been used by customers to send hundreds of millions of log lines to various destinations. While the majority of our customers were able to aggregate their logs without hiccup, we also heard a few of them experience issues when the volume of logs being generated were extremely high. These issues ranged from inconvenient delays in receiving logs in their destinations to packet losses during periods of high throughput.
So we decided to fix this by engineering and releasing a new version of Aptible log drains.
What customers can expect with this new version of log drains
The log drains of all Aptible accounts have been updated to the latest version, requiring no additional setup from customers. Customers can expect the following from the latest version.
Improved performance With this update, users can see a noticeable improvement in the reliability and speed of their log drains. Customers may experience minimal to no lag when generating and sending their logs, even at very high volumes due to the work we put in to increase throughput in the new version of our drains.
Better internal observability for faster remediation Using a combination of FluentD data, and visualizing and graphing this data into metrics of importance in Grafana, we’ve been able to set up alerts to monitor for issues based on the the the number of logs waiting to be sent , the number of times customer drains retry sending logs, failed output writes to different destinations, and others. We believe these metrics allow our reliability engineers to quickly identify root-causes, be it on Aptible’s side or the customer's side as issues arise, and remediate them more efficiently.
Over time, we’ll evolve these metrics as we learn how our newest version of log drains performs in a wider variety of real world scenarios. Depending on how well these metrics perform, we may also choose to expose them to customers to enable more proactive, self-service remediation of log drain issues.
Jun 17, 2021
Jun 7, 2021
We are very excited to introduce a new command for the Aptible CLI : aptible db:modify. This command lets you make modifications to your databases without requiring any restarts.
Currently, the modifications we support are related to your database’s Disk IO performance.
An example of this is moving your database volumes to gp3. You can update your existing gp2 volumes to gp3, which provides a predictable 3,000 IOPS in baseline performance, with the added ability to provision performance independent of storage capacity. Moving to gp3 volumes should result in sizable performance improvements to sustained disk IO for most databases.
Examplesaptible db:modify $DB_HANDLE --volume-type gp3 aptible db:modify $DB_HANDLE --iops 9000 aptible db:modify $DB_HANDLE --volume-type gp3 --iops 9000
Note: Additional database disk I/O operations per second provisioned over the baseline (3000 IOPS) is priced at $0.01/Provisioned IO/Month. See our pricing page to calculate your costs based on your IOPS needs.
You can also specify the volume type and IOPS in other commands as well. For example If you want to convert a volume type and size in just one operation, you can do so in a single db: restart command:
Exampleaptible db:restart $DB_HANDLE --disk-size 200 --volume-type gp3
Head on over to the download page to grab version 0.18.1 of the Aptible CLI and use these new options today: /docs/cli
Jun 7, 2021
Jun 7, 2021
We are very excited to introduce a new command for the Aptible CLI : aptible db:modify. This command lets you make modifications to your databases without requiring any restarts.
Currently, the modifications we support are related to your database’s Disk IO performance.
An example of this is moving your database volumes to gp3. You can update your existing gp2 volumes to gp3, which provides a predictable 3,000 IOPS in baseline performance, with the added ability to provision performance independent of storage capacity. Moving to gp3 volumes should result in sizable performance improvements to sustained disk IO for most databases.
Examplesaptible db:modify $DB_HANDLE --volume-type gp3 aptible db:modify $DB_HANDLE --iops 9000 aptible db:modify $DB_HANDLE --volume-type gp3 --iops 9000
Note: Additional database disk I/O operations per second provisioned over the baseline (3000 IOPS) is priced at $0.01/Provisioned IO/Month. See our pricing page to calculate your costs based on your IOPS needs.
You can also specify the volume type and IOPS in other commands as well. For example If you want to convert a volume type and size in just one operation, you can do so in a single db: restart command:
Exampleaptible db:restart $DB_HANDLE --disk-size 200 --volume-type gp3
Head on over to the download page to grab version 0.18.1 of the Aptible CLI and use these new options today: /docs/cli
Jun 7, 2021
May 17, 2021
We understand that reviewing your backups regularly is essential for business continuity planning and optimizing your infrastructure spend.
To make this easier, we’ve added appropriate tags in the UI so you can quickly differentiate backups created manually or automatically. Here's an example below:
Aptible Backup Tags
You can also see the equivalent of this through the CLI using the aptible backup:list command. Please make sure you're on version 0.18.3 or higher of the CLI.
May 17, 2021
May 17, 2021
We understand that reviewing your backups regularly is essential for business continuity planning and optimizing your infrastructure spend.
To make this easier, we’ve added appropriate tags in the UI so you can quickly differentiate backups created manually or automatically. Here's an example below:
Aptible Backup Tags
You can also see the equivalent of this through the CLI using the aptible backup:list command. Please make sure you're on version 0.18.3 or higher of the CLI.
May 17, 2021
Feb 12, 2021
All new Aptible Deploy databases created today - either newly provisioned or restored from backup - will default to using gp3 volumes. This new volume type provides a baseline IOPS performance of 3,000 IOPS without regard for disk size. For most databases, this will be a large improvement on existing performance. However, some larger databases (bigger than 1 TB) may require more IOPS. If you would like to provision more than 3000 IOPS, reach out to support@aptible.com and we can help you with this - up to 16,000 IOPS.
All new Aptible Deploy databases created today - either newly provisioned or restored from backup - will default to using gp3 volumes. This new volume type provides a baseline IOPS performance of 3,000 IOPS without regard for disk size. For most databases, this will be a large improvement on existing performance. However, some larger databases (bigger than 1 TB) may require more IOPS. If you would like to provision more than 3000 IOPS, reach out to support@aptible.com and we can help you with this - up to 16,000 IOPS.
Feb 12, 2021
Feb 12, 2021
All new Aptible Deploy databases created today - either newly provisioned or restored from backup - will default to using gp3 volumes. This new volume type provides a baseline IOPS performance of 3,000 IOPS without regard for disk size. For most databases, this will be a large improvement on existing performance. However, some larger databases (bigger than 1 TB) may require more IOPS. If you would like to provision more than 3000 IOPS, reach out to support@aptible.com and we can help you with this - up to 16,000 IOPS.
All new Aptible Deploy databases created today - either newly provisioned or restored from backup - will default to using gp3 volumes. This new volume type provides a baseline IOPS performance of 3,000 IOPS without regard for disk size. For most databases, this will be a large improvement on existing performance. However, some larger databases (bigger than 1 TB) may require more IOPS. If you would like to provision more than 3000 IOPS, reach out to support@aptible.com and we can help you with this - up to 16,000 IOPS.
Feb 12, 2021
Dec 15, 2020
Aptible has released support for version 7 of the Elasticsearch Database type. This major version includes:
Native user authentication and HTTPS - previously this was achieved in Deploy with a proxy in front of the database
Compatibility with Elasticsearch's official Kibana image
Log rotation and backups via Kibana's Index Lifecycle Management and Snapshot Lifecycle Management
Users of our aptible/elasticsearch-logstash-s3-backup application for past versions of Elasticsearch will be pleased to learn that functionality is now native in Kibana for Elasticsearch 7.
We have a setup guide as well as documentation for the new version for your reading pleasure!
Dec 15, 2020
Dec 15, 2020
Aptible has released support for version 7 of the Elasticsearch Database type. This major version includes:
Native user authentication and HTTPS - previously this was achieved in Deploy with a proxy in front of the database
Compatibility with Elasticsearch's official Kibana image
Log rotation and backups via Kibana's Index Lifecycle Management and Snapshot Lifecycle Management
Users of our aptible/elasticsearch-logstash-s3-backup application for past versions of Elasticsearch will be pleased to learn that functionality is now native in Kibana for Elasticsearch 7.
We have a setup guide as well as documentation for the new version for your reading pleasure!
Dec 15, 2020
Sep 28, 2020
Deploy’s application scheduler can now automatically provision additional host capacity if it detects that placing the application’s containers on existing hosts may overly tax the existing resources or concentrate the containers on a single host or availability zone. The effect of this change will be to improve the performance and reliability of applications at no additional cost to our users.
Previously, our system would attempt to place all containers for application as quickly as possible, avoiding any delays in releasing the new or restarted applications. In some cases, it would then flag the allocation and our Reliability Team would asynchronously review and take action as necessary to ensure the reliability of the applications. In the vast majority of cases during the past few years, this behavior has worked well and delivered the expected results.
However, as we continually improve our hosting platform, we identified this as an area of improvement to avoid the rare edge cases where this asynchronous response may pose an issue. The most frequent situation was a significant scale up in the number or size of containers for a given application. After refining our detection mechanism, Deploy will now automatically be proactive in adding capacity during the scheduling of containers to mitigate the risk of such scaling actions.
The main change in Deploy’s behavior from a customer's perspective will be an occasional delay in completing deployment or scaling operations on applications. The delay should be short, often 10-15 minutes, while new host capacity is brought online. This is similar to the possible delays with provisioning Databases. The operation is proceeding correctly during the delay. If any errors do occur they will be displayed on the dashboard or CLI.
Sep 28, 2020
Sep 28, 2020
Deploy’s application scheduler can now automatically provision additional host capacity if it detects that placing the application’s containers on existing hosts may overly tax the existing resources or concentrate the containers on a single host or availability zone. The effect of this change will be to improve the performance and reliability of applications at no additional cost to our users.
Previously, our system would attempt to place all containers for application as quickly as possible, avoiding any delays in releasing the new or restarted applications. In some cases, it would then flag the allocation and our Reliability Team would asynchronously review and take action as necessary to ensure the reliability of the applications. In the vast majority of cases during the past few years, this behavior has worked well and delivered the expected results.
However, as we continually improve our hosting platform, we identified this as an area of improvement to avoid the rare edge cases where this asynchronous response may pose an issue. The most frequent situation was a significant scale up in the number or size of containers for a given application. After refining our detection mechanism, Deploy will now automatically be proactive in adding capacity during the scheduling of containers to mitigate the risk of such scaling actions.
The main change in Deploy’s behavior from a customer's perspective will be an occasional delay in completing deployment or scaling operations on applications. The delay should be short, often 10-15 minutes, while new host capacity is brought online. This is similar to the possible delays with provisioning Databases. The operation is proceeding correctly during the delay. If any errors do occur they will be displayed on the dashboard or CLI.
Sep 28, 2020
Sep 2, 2020
Our terraform provider has been published on the Terraform Registry. Please see https://registry.terraform.io/providers/aptible/aptible for installation instructions.
Our terraform provider has been published on the Terraform Registry. Please see https://registry.terraform.io/providers/aptible/aptible for installation instructions.
Sep 2, 2020
Sep 2, 2020
Our terraform provider has been published on the Terraform Registry. Please see https://registry.terraform.io/providers/aptible/aptible for installation instructions.
Our terraform provider has been published on the Terraform Registry. Please see https://registry.terraform.io/providers/aptible/aptible for installation instructions.
Sep 2, 2020
Mar 25, 2020
The Deploy Dashboard has been updated to improve its security and the clarity of its navigation. These updates should not impact the majority of our users' daily workflows. For those impacted, we hope these changes will lead to an improved experience.
Managing SSH keys and logging out all sessions now require a re-authentication before being accessible. This brings these two security-relevant options up to the same standard as the "Security Settings" in the Dashboard. Requiring re-authentication prevents someone who has gained access to an existing session, for example by taking an unattended laptop, from taking these actions. As part of this change, the "Log out all sessions" checkbox will no longer appear in the regular log out process. It will continue to be available in "Security Settings."
For users in multiple organizations, the Dashboard now provides an option to switch between each organization individually. The selector will appear in the upper right of the dashboard if you are a member of multiple organizations. The Deploy resources displayed will now be only for the selected organization, reducing the visual clutter and preventing accidental resource creation in the incorrect organization. As our customer base continues to grow and mature, they have increased their use of multiple organizations for corporate or compliance reasons. We hope this change will improve the usability of the Dashboard for those users.
Mar 25, 2020
Mar 25, 2020
The Deploy Dashboard has been updated to improve its security and the clarity of its navigation. These updates should not impact the majority of our users' daily workflows. For those impacted, we hope these changes will lead to an improved experience.
Managing SSH keys and logging out all sessions now require a re-authentication before being accessible. This brings these two security-relevant options up to the same standard as the "Security Settings" in the Dashboard. Requiring re-authentication prevents someone who has gained access to an existing session, for example by taking an unattended laptop, from taking these actions. As part of this change, the "Log out all sessions" checkbox will no longer appear in the regular log out process. It will continue to be available in "Security Settings."
For users in multiple organizations, the Dashboard now provides an option to switch between each organization individually. The selector will appear in the upper right of the dashboard if you are a member of multiple organizations. The Deploy resources displayed will now be only for the selected organization, reducing the visual clutter and preventing accidental resource creation in the incorrect organization. As our customer base continues to grow and mature, they have increased their use of multiple organizations for corporate or compliance reasons. We hope this change will improve the usability of the Dashboard for those users.
Mar 25, 2020
Nov 7, 2019
Aptible Deploy now uses A record entries in public DNS for new Database Credential hostnames, enabling customers with connectivity into their Deploy environment to resolve the hostname from outside. The DNS record will directly return the private IP address of the database inside their Deploy environment. This change will not affect the vast majority of our customers' operations and does not impact public Endpoints at all.
Previously, we used DNS CNAME records for Database Credential hostnames. Those records could only be resolved within the AWS Region in which they were hosted, preventing customers using a VPC peering connection or VPN tunnel from connecting directly to the database. Instead, they had to rely on an internal endpoint or a hardcoded IP address. This change removes the need for those workarounds.
To update an existing database to use an A record, you will need to restart your database.
Nov 7, 2019
Nov 7, 2019
Aptible Deploy now uses A record entries in public DNS for new Database Credential hostnames, enabling customers with connectivity into their Deploy environment to resolve the hostname from outside. The DNS record will directly return the private IP address of the database inside their Deploy environment. This change will not affect the vast majority of our customers' operations and does not impact public Endpoints at all.
Previously, we used DNS CNAME records for Database Credential hostnames. Those records could only be resolved within the AWS Region in which they were hosted, preventing customers using a VPC peering connection or VPN tunnel from connecting directly to the database. Instead, they had to rely on an internal endpoint or a hardcoded IP address. This change removes the need for those workarounds.
To update an existing database to use an A record, you will need to restart your database.
Nov 7, 2019
Oct 30, 2019
The latest version of the Aptible CLI (version 0.16.3) now supports creating replicas or replica sets for MySQL, PostgreSQL, Redis, and MongoDB databases.
Visit the Aptible Deploy docs for more information on how to create a replica or replica set.
The latest version of the Aptible CLI (version 0.16.3) now supports creating replicas or replica sets for MySQL, PostgreSQL, Redis, and MongoDB databases.
Visit the Aptible Deploy docs for more information on how to create a replica or replica set.
Oct 30, 2019
Oct 30, 2019
The latest version of the Aptible CLI (version 0.16.3) now supports creating replicas or replica sets for MySQL, PostgreSQL, Redis, and MongoDB databases.
Visit the Aptible Deploy docs for more information on how to create a replica or replica set.
The latest version of the Aptible CLI (version 0.16.3) now supports creating replicas or replica sets for MySQL, PostgreSQL, Redis, and MongoDB databases.
Visit the Aptible Deploy docs for more information on how to create a replica or replica set.
Oct 30, 2019
May 23, 2018
We are proud to announce that Managed TLS now supports wildcard certificates.
To set up a Managed TLS Endpoint using a wildcard certificate, simply use the wildcard format when specifying your Custom Domain (e.g. *.aptible.com).
Note that you’ll have to use dns-01 validation to validate a wildcard certificate. In any case, the Dashboard or CLI will walk you through the CNAMEs you need to create to proceed.
May 23, 2018
May 23, 2018
We are proud to announce that Managed TLS now supports wildcard certificates.
To set up a Managed TLS Endpoint using a wildcard certificate, simply use the wildcard format when specifying your Custom Domain (e.g. *.aptible.com).
Note that you’ll have to use dns-01 validation to validate a wildcard certificate. In any case, the Dashboard or CLI will walk you through the CNAMEs you need to create to proceed.
May 23, 2018
May 23, 2018
We are proud to announce that we have overhauled our billing system in order to provide you with better visibility into your costs for Enclave and Gridiron.
Notably, our new billing platform provides you with the information you need to estimate and understand your costs:
Real-time billing projections and breakdowns.
Centralized access to historical invoices.
A listing of your contracted terms past and current.
As of this release, you can also manage multiple payment methods, add multiple billing contacts, and review your payments for past invoices.
May 23, 2018
May 23, 2018
We are proud to announce that we have overhauled our billing system in order to provide you with better visibility into your costs for Enclave and Gridiron.
Notably, our new billing platform provides you with the information you need to estimate and understand your costs:
Real-time billing projections and breakdowns.
Centralized access to historical invoices.
A listing of your contracted terms past and current.
As of this release, you can also manage multiple payment methods, add multiple billing contacts, and review your payments for past invoices.
May 23, 2018
May 23, 2018
Considering Appcanary’s immiment shutdown, we are happy to announce that Enclave’s Security Scans now use Clairinstead.
Clair is an open-source container vulnerability analysis platform from CoreOS. However, as an end-user of Enclave’s Security Scans, this change will be fairly transparent to you.
Considering Appcanary’s immiment shutdown, we are happy to announce that Enclave’s Security Scans now use Clairinstead.
Clair is an open-source container vulnerability analysis platform from CoreOS. However, as an end-user of Enclave’s Security Scans, this change will be fairly transparent to you.
May 23, 2018
May 23, 2018
Considering Appcanary’s immiment shutdown, we are happy to announce that Enclave’s Security Scans now use Clairinstead.
Clair is an open-source container vulnerability analysis platform from CoreOS. However, as an end-user of Enclave’s Security Scans, this change will be fairly transparent to you.
Considering Appcanary’s immiment shutdown, we are happy to announce that Enclave’s Security Scans now use Clairinstead.
Clair is an open-source container vulnerability analysis platform from CoreOS. However, as an end-user of Enclave’s Security Scans, this change will be fairly transparent to you.
May 23, 2018
May 23, 2018
Enclave now limits the number of processes running on your containers to 16384. For comparison, a full Linux host limits the process count to 32768 by default (although we do use higher limits on Enclave hosts).
As such, this limit is extremely unlikely to affect you as a customer, but will provide meaningful stability improvements to the platform.
That said, if you’d like to monitor your process counts across containers, and compare them to the limit, we’ve exposed process counts and limits in Metric Drains.
May 23, 2018
May 23, 2018
Enclave now limits the number of processes running on your containers to 16384. For comparison, a full Linux host limits the process count to 32768 by default (although we do use higher limits on Enclave hosts).
As such, this limit is extremely unlikely to affect you as a customer, but will provide meaningful stability improvements to the platform.
That said, if you’d like to monitor your process counts across containers, and compare them to the limit, we’ve exposed process counts and limits in Metric Drains.
May 23, 2018
May 23, 2018
We are proud to announce that Enclave now supports CouchDB as a Database on Enclave.
CouchDB is a replication-centric database, with capabilities for offline mobile sync.
Version 2.1 is currently supported. You can launch CouchDB Databases throuh the Dashboard or the CLI.
We are proud to announce that Enclave now supports CouchDB as a Database on Enclave.
CouchDB is a replication-centric database, with capabilities for offline mobile sync.
Version 2.1 is currently supported. You can launch CouchDB Databases throuh the Dashboard or the CLI.
May 23, 2018
May 23, 2018
We are proud to announce that Enclave now supports CouchDB as a Database on Enclave.
CouchDB is a replication-centric database, with capabilities for offline mobile sync.
Version 2.1 is currently supported. You can launch CouchDB Databases throuh the Dashboard or the CLI.
We are proud to announce that Enclave now supports CouchDB as a Database on Enclave.
CouchDB is a replication-centric database, with capabilities for offline mobile sync.
Version 2.1 is currently supported. You can launch CouchDB Databases throuh the Dashboard or the CLI.
May 23, 2018
Apr 22, 2018
For reliability purposes, LogDNA has added support for receiving your logs via HTTPS, instead of Syslog, from Enclave Log Drains. Aptible recommends all Enclave customers to make the switch to HTTPS delivery.
For new Log Drains, the guided setup will prompt you for a URL, rather than a Host and Port combination. Please review LogDNA’s documentation for the correct URL to use, as it will require your LogDNA Injestion Key : https://docs.logdna.com/docs/aptible-logs
For your existing LogDNA Log Drains, you should replace each Syslog drain with a new HTTPS Log Drain. Be sure to create the new HTTPS Drain before deleteing the Syslog one, to avoid interruption in delivery.
Apr 22, 2018
Apr 22, 2018
For reliability purposes, LogDNA has added support for receiving your logs via HTTPS, instead of Syslog, from Enclave Log Drains. Aptible recommends all Enclave customers to make the switch to HTTPS delivery.
For new Log Drains, the guided setup will prompt you for a URL, rather than a Host and Port combination. Please review LogDNA’s documentation for the correct URL to use, as it will require your LogDNA Injestion Key : https://docs.logdna.com/docs/aptible-logs
For your existing LogDNA Log Drains, you should replace each Syslog drain with a new HTTPS Log Drain. Be sure to create the new HTTPS Drain before deleteing the Syslog one, to avoid interruption in delivery.
Apr 22, 2018
Mar 15, 2018
We’re proud to announce that Elasticsearch 6.2 is now available on Enclave. You can choose Elasticsearch 6.2 when creating a new database, and it is also the default.
In addition to Elasticsearch 6.2, we’ve added support for 4 (!) additional versions: Elasticsearch 6.1, 6.0, 5.6, and 5.1. We’ll continue to support 5.0, 2.4, and 2.2. Whatever specific version requirements you may have, Enclave has you covered.
Updates to Kibana
If you’re using Kibana alongside your Enclave Elasticsearch database (for example, as part of a self-hosted ELK stack), you’ll be happy to know that we’ve released new Kibana versions to match each new Elasticsearch version. (Note that if you’re using an Elasticsearch 6.2 database, for example, you’ll need to use Kibana 6.2 as well.)
As an added bonus, we’ve updated the Kibana app deploy process to use Direct Docker Image Deploy by default. Now, upgrading your existing Kibana to point to a new Elasticsearch database (and version) can be as simple as:
aptible deploy --git-detach --docker-image aptible/kibana:$VERSION DATABASE_URL=$NEW_DATABASE_URL
Please refer to the aptible/kibana README for additional information, including instructions for deploying a new Kibana app.
Mar 15, 2018
Mar 15, 2018
We’re proud to announce that Elasticsearch 6.2 is now available on Enclave. You can choose Elasticsearch 6.2 when creating a new database, and it is also the default.
In addition to Elasticsearch 6.2, we’ve added support for 4 (!) additional versions: Elasticsearch 6.1, 6.0, 5.6, and 5.1. We’ll continue to support 5.0, 2.4, and 2.2. Whatever specific version requirements you may have, Enclave has you covered.
Updates to Kibana
If you’re using Kibana alongside your Enclave Elasticsearch database (for example, as part of a self-hosted ELK stack), you’ll be happy to know that we’ve released new Kibana versions to match each new Elasticsearch version. (Note that if you’re using an Elasticsearch 6.2 database, for example, you’ll need to use Kibana 6.2 as well.)
As an added bonus, we’ve updated the Kibana app deploy process to use Direct Docker Image Deploy by default. Now, upgrading your existing Kibana to point to a new Elasticsearch database (and version) can be as simple as:
aptible deploy --git-detach --docker-image aptible/kibana:$VERSION DATABASE_URL=$NEW_DATABASE_URL
Please refer to the aptible/kibana README for additional information, including instructions for deploying a new Kibana app.
Mar 15, 2018
Jan 31, 2018
We’re proud to announce that you can now include a Procfile and a .aptible.yml file in your Docker images. This lets you use a Procfile or .aptible.yml file with Direct Docker Image Deploy without the need for a Companion Git Repository.
This change only impacts customers who are using Direct Docker Image Deploy and leveraging a Companion Git Repository to provide a Procfile or .aptible.yml file.
If that’s your case, follow the steps below to upgrade to this new method. The key benefit of upgrading is that you will no longer need to use both a Docker image and a git repository to deploy: the Docker image alone will suffice.
If you are using a Procfile, include it in your Docker image at /.aptible/Procfile.
If you are using a .aptible.yml file, include it in your Docker image at /.aptible/.aptible.yml.
Build your Docker image, then run aptible deploy with the --git-detach flag. This will ensure your git repository is ignored going forward, and that your Procfile and .aptible.yml files are read from your Docker image instead. You’ll never need to interact with the git repository again.
With this change, using a Companion Git Repository is now deprecated. However, we are not planning on removing this feature, so you’re free to migrate on your schedule, when it’s convenient for you to do so.
Jan 31, 2018
Jan 31, 2018
We’re proud to announce that you can now include a Procfile and a .aptible.yml file in your Docker images. This lets you use a Procfile or .aptible.yml file with Direct Docker Image Deploy without the need for a Companion Git Repository.
This change only impacts customers who are using Direct Docker Image Deploy and leveraging a Companion Git Repository to provide a Procfile or .aptible.yml file.
If that’s your case, follow the steps below to upgrade to this new method. The key benefit of upgrading is that you will no longer need to use both a Docker image and a git repository to deploy: the Docker image alone will suffice.
If you are using a Procfile, include it in your Docker image at /.aptible/Procfile.
If you are using a .aptible.yml file, include it in your Docker image at /.aptible/.aptible.yml.
Build your Docker image, then run aptible deploy with the --git-detach flag. This will ensure your git repository is ignored going forward, and that your Procfile and .aptible.yml files are read from your Docker image instead. You’ll never need to interact with the git repository again.
With this change, using a Companion Git Repository is now deprecated. However, we are not planning on removing this feature, so you’re free to migrate on your schedule, when it’s convenient for you to do so.
Jan 31, 2018
Jan 15, 2018
We are proud to announce the release of Enclave Metric Drains. Metric Drains are the metrics counterpart of Log Drains: you configure them as a destination, and Enclave will periodically publish metrics for your Containers to the Metric Drain.
As of today, supported metrics include CPU and RAM usage for all containers, and disk usage and I/O for databases. As for destinations, you can route metrics to InfluxDB (self-hosted on Enclave and third-party) and Datadog.
This feature greatly expands our previously-released Dashboard Container Metrics, and will be particularly useful for sophisticated use cases that require real-time or historical access to detailed metrics.
Indeed, unlike Dashboard Container Metrics, Metric Drains allow you to:
Review metrics across releases and as far back as you’d like: since the metrics are pushed to you, you are free to define your own retention policies.
Alert when metrics cross pre-defined thresholds of your choosing: here again, since we’re pushing metrics to you, you’re free to alert on them however you’d like (alerting is respectively available in Grafana and in Datadog).
Correlate metrics with other sources of information: at this time, Metric Drains support pushing metrics to InfluxDB as well as Datadog, where you might already be publishing other metrics (e.g. using an application performance monitoring tool).
To provision a new Metric Drain, navigate to Environment of your choice in the Dashboard, and open the Metric Drains tab.
PS: To make it easier to get started with Metric Drains, we also added support for InfluxDB as a Database on Enclave. This lets you easily route metrics to a self-hosted InfluxDB database. We also have detailed instructions on deploying Grafana on Enclave to create beautiful Dashboards and set up monitoring using these metrics.
Jan 15, 2018
Jan 15, 2018
We are proud to announce the release of Enclave Metric Drains. Metric Drains are the metrics counterpart of Log Drains: you configure them as a destination, and Enclave will periodically publish metrics for your Containers to the Metric Drain.
As of today, supported metrics include CPU and RAM usage for all containers, and disk usage and I/O for databases. As for destinations, you can route metrics to InfluxDB (self-hosted on Enclave and third-party) and Datadog.
This feature greatly expands our previously-released Dashboard Container Metrics, and will be particularly useful for sophisticated use cases that require real-time or historical access to detailed metrics.
Indeed, unlike Dashboard Container Metrics, Metric Drains allow you to:
Review metrics across releases and as far back as you’d like: since the metrics are pushed to you, you are free to define your own retention policies.
Alert when metrics cross pre-defined thresholds of your choosing: here again, since we’re pushing metrics to you, you’re free to alert on them however you’d like (alerting is respectively available in Grafana and in Datadog).
Correlate metrics with other sources of information: at this time, Metric Drains support pushing metrics to InfluxDB as well as Datadog, where you might already be publishing other metrics (e.g. using an application performance monitoring tool).
To provision a new Metric Drain, navigate to Environment of your choice in the Dashboard, and open the Metric Drains tab.
PS: To make it easier to get started with Metric Drains, we also added support for InfluxDB as a Database on Enclave. This lets you easily route metrics to a self-hosted InfluxDB database. We also have detailed instructions on deploying Grafana on Enclave to create beautiful Dashboards and set up monitoring using these metrics.
Jan 15, 2018
Jan 15, 2018
We’re proud to announce that we have added support for InfluxDB as a database on Enclave.
InfluxDB is a high-performance time-series database, which we’ve been using ourselves for our Container Metrics. It works particularly well with Grafana to quickly create insightful Dashboards.
Adding InfluxDB as a Database on Enclave was motivated by the introduction of Metric Drains, but you can of course use it for any use case.
Like any other supported Database, you can launch an InfluxDB Database through the Dashboard, or using the CLI.
Jan 15, 2018
Jan 15, 2018
We’re proud to announce that we have added support for InfluxDB as a database on Enclave.
InfluxDB is a high-performance time-series database, which we’ve been using ourselves for our Container Metrics. It works particularly well with Grafana to quickly create insightful Dashboards.
Adding InfluxDB as a Database on Enclave was motivated by the introduction of Metric Drains, but you can of course use it for any use case.
Like any other supported Database, you can launch an InfluxDB Database through the Dashboard, or using the CLI.
Jan 15, 2018
Dec 6, 2017
Enclave has historically supported IPSEC VPN Tunnels and VPC Peering, we’re happy to announce that you can now view the status of these networks integrations for a given stack via the Aptible Dashboard.
To view these, navigate to the VPN Tunnels or VPC Peering tabs for a Stack. Keep in mind that VPN Tunnels and VPC Peering are only available for Dedicated-Tenancy Stacks.
Dec 6, 2017
Dec 6, 2017
Enclave has historically supported IPSEC VPN Tunnels and VPC Peering, we’re happy to announce that you can now view the status of these networks integrations for a given stack via the Aptible Dashboard.
To view these, navigate to the VPN Tunnels or VPC Peering tabs for a Stack. Keep in mind that VPN Tunnels and VPC Peering are only available for Dedicated-Tenancy Stacks.
Dec 6, 2017
Dec 5, 2017
Since the introduction of Self-Service Database Scaling on Enclave, you’ve been able to conveniently resize your database containers to fit the evolution of your workload over time.
As of this week, we’re proud to announce that we’re taking this feature one step further by automatically configuring databases for optimum performance based on their container footprint.
Here’s what we do:
Note that these settings only apply to databases launched after 12:00 UTC on December 4, 2017. For databases you launched before this date, you can use the aptible db:reload command to restart your database using this new configuration (this will cause a few seconds of downtime while your database restarts).
These new parameters are expected to yield better performance for most workloads, and help you better utilize the resources available to your database containers. That said, if you had previously opted to customize the configuration of your database (for PostgreSQL, you might have done so using ALTER SYSTEM), or would like to do so now to further improve performance, your custom parameters will take precedence over Enclave’s optimized configuration.
Dec 5, 2017
Dec 5, 2017
Since the introduction of Self-Service Database Scaling on Enclave, you’ve been able to conveniently resize your database containers to fit the evolution of your workload over time.
As of this week, we’re proud to announce that we’re taking this feature one step further by automatically configuring databases for optimum performance based on their container footprint.
Here’s what we do:
Note that these settings only apply to databases launched after 12:00 UTC on December 4, 2017. For databases you launched before this date, you can use the aptible db:reload command to restart your database using this new configuration (this will cause a few seconds of downtime while your database restarts).
These new parameters are expected to yield better performance for most workloads, and help you better utilize the resources available to your database containers. That said, if you had previously opted to customize the configuration of your database (for PostgreSQL, you might have done so using ALTER SYSTEM), or would like to do so now to further improve performance, your custom parameters will take precedence over Enclave’s optimized configuration.
Dec 5, 2017
Dec 5, 2017
We’re pleased to announce that the aptible db:create command now supports a --version flag, which allows you to select the version for the database you’re provisioning.
To list available database versions, use the aptible db:versions command.
We’re pleased to announce that the aptible db:create command now supports a --version flag, which allows you to select the version for the database you’re provisioning.
To list available database versions, use the aptible db:versions command.
Dec 5, 2017
Dec 5, 2017
We’re pleased to announce that the aptible db:create command now supports a --version flag, which allows you to select the version for the database you’re provisioning.
To list available database versions, use the aptible db:versions command.
We’re pleased to announce that the aptible db:create command now supports a --version flag, which allows you to select the version for the database you’re provisioning.
To list available database versions, use the aptible db:versions command.
Dec 5, 2017
Oct 31, 2017
Enclave now automatically re-configures MongoDB replica sets when restoring from backup. Prior to this change, this reconfiguration step would have had to be performed manually.
Here’s why: previously, when restoring a MongoDB backup, the new MongoDB instance would start with the replica set configuration that was in effect when the backup was created. This would cause the new MongoDB instance to try and join your existing database’s replica set. This, in turn, would fail because the new MongoDB instance was not a member of your existing database’s replica set, and the new MongoDB instance would transition to REMOVED state.
Now, when restoring a backup, you precisely don’t want the new MongoDB instance to become a member of your existing database’s replica set (however, note that we do support MongoDB clustering when you need it). Indeed, you probably want to use the new MongoDB instance for troubleshooting, development or reporting, and the last thing you want is for changes you make on the new MongoDB instance to affect your existing database!
The right approach in this case is to reconfigure the new MongoDB instance with its own independent replica set. Until now, this was a manual process, but as of today, Enclave does it automatically for you as part of the backup restoration process.
Oct 31, 2017
Oct 31, 2017
Enclave now automatically re-configures MongoDB replica sets when restoring from backup. Prior to this change, this reconfiguration step would have had to be performed manually.
Here’s why: previously, when restoring a MongoDB backup, the new MongoDB instance would start with the replica set configuration that was in effect when the backup was created. This would cause the new MongoDB instance to try and join your existing database’s replica set. This, in turn, would fail because the new MongoDB instance was not a member of your existing database’s replica set, and the new MongoDB instance would transition to REMOVED state.
Now, when restoring a backup, you precisely don’t want the new MongoDB instance to become a member of your existing database’s replica set (however, note that we do support MongoDB clustering when you need it). Indeed, you probably want to use the new MongoDB instance for troubleshooting, development or reporting, and the last thing you want is for changes you make on the new MongoDB instance to affect your existing database!
The right approach in this case is to reconfigure the new MongoDB instance with its own independent replica set. Until now, this was a manual process, but as of today, Enclave does it automatically for you as part of the backup restoration process.
Oct 31, 2017
Oct 31, 2017
We’re happy to announce that you can now opt-in to Strict Health Checks for your Apps hosted on Enclave.
If you enable Strict Health Checks, Enclave will expect your app to respond on the /healthcheck route with 200 OK if it’s healthy, and any other status if not.
In contrast, if you do not enable this feature (i.e. just leave things as-is) enabled, Enclave simply expects your app to return a valid HTTP response (i.e. a 404 would be acceptable).
Strict Health Checks apply both to Release Health Checks and Runtime Health Checks. Release Health Checks let you cancel the deployment of your app if health checks are failing, and Runtime Health Checks let you route traffic away from unhealthy containers or failover to Enclave’s error page server if all your containers are down.
Oct 31, 2017
Oct 31, 2017
We’re happy to announce that you can now opt-in to Strict Health Checks for your Apps hosted on Enclave.
If you enable Strict Health Checks, Enclave will expect your app to respond on the /healthcheck route with 200 OK if it’s healthy, and any other status if not.
In contrast, if you do not enable this feature (i.e. just leave things as-is) enabled, Enclave simply expects your app to return a valid HTTP response (i.e. a 404 would be acceptable).
Strict Health Checks apply both to Release Health Checks and Runtime Health Checks. Release Health Checks let you cancel the deployment of your app if health checks are failing, and Runtime Health Checks let you route traffic away from unhealthy containers or failover to Enclave’s error page server if all your containers are down.
Oct 31, 2017
Oct 24, 2017
We’re proud to announce that Environment creation on Enclave is now fully self-service. You can access this menu by clicking “Create Environment” from the sidebar:
As an Enclave user, this has two main implications for you:
When creating a new Shared-Tenancy Environment, you can now pick from a selection of eligible Shared-Tenancy Stacks. For example, you can now deploy in us-west-1 (N. California) or eu-central-1 (Frankfurt).
When creating a new Dedicated-Tenancy Environment, you no longer need to wait for us to activate your Environment after creating it. Instead, your Environment automatically activates, and you can start using it right away.
As part of this change, we’ve also upgraded the Dashboard sidebar to show you not only your Environments, but also the Stacks they’re deployed on, which gives you greater visibility into how your Enclave resources are organized.
This change is a good opportunity for a quick review of how Stacks and Environments relate. Here’s what you need to know:
Stacks are isolated virtual networks (AWS VPCs) consisting of a number of Docker hosts (AWS EC2 instances). Environments are mapped onto Stacks and provide a logical isolation layer.
Apps and Databases for a given Environment are deployed on the Docker hosts for the Environment’s Stack. There is no network-level isolation between Apps and Databases belonging to different Environments if they are deployed on the same Stack.
Stacks can be single-tenant (Dedicated Tenancy) or multi-tenant (Shared Tenancy). Environments that process PHI must be deployed on Dedicated-Tenancy Stacks as per your BAA with Aptible.
Oct 24, 2017
Oct 24, 2017
We’re proud to announce that Environment creation on Enclave is now fully self-service. You can access this menu by clicking “Create Environment” from the sidebar:
As an Enclave user, this has two main implications for you:
When creating a new Shared-Tenancy Environment, you can now pick from a selection of eligible Shared-Tenancy Stacks. For example, you can now deploy in us-west-1 (N. California) or eu-central-1 (Frankfurt).
When creating a new Dedicated-Tenancy Environment, you no longer need to wait for us to activate your Environment after creating it. Instead, your Environment automatically activates, and you can start using it right away.
As part of this change, we’ve also upgraded the Dashboard sidebar to show you not only your Environments, but also the Stacks they’re deployed on, which gives you greater visibility into how your Enclave resources are organized.
This change is a good opportunity for a quick review of how Stacks and Environments relate. Here’s what you need to know:
Stacks are isolated virtual networks (AWS VPCs) consisting of a number of Docker hosts (AWS EC2 instances). Environments are mapped onto Stacks and provide a logical isolation layer.
Apps and Databases for a given Environment are deployed on the Docker hosts for the Environment’s Stack. There is no network-level isolation between Apps and Databases belonging to different Environments if they are deployed on the same Stack.
Stacks can be single-tenant (Dedicated Tenancy) or multi-tenant (Shared Tenancy). Environments that process PHI must be deployed on Dedicated-Tenancy Stacks as per your BAA with Aptible.
Oct 24, 2017
Oct 10, 2017
We’re happy to announce that TCP and TLS Endpoints have left private beta and are now generally available in Enclave!
Compared to Enclave’s other Endpoint type (HTTPS Endpoints), TCP and TLS Endpoints are lower-level primitives that give you more flexibility. For example, you can use TCP or TLS Endpoints to deploy non-HTTP apps on Enclave, or take ownership of TLS termination in your app. One particularly notable use case for healthcare companies is to run a Mirth Connect receiver to ingest HL7 data.
Note that, being lower-level primitives, TCP and TLS Endpoints do not include as many bells and whistles as HTTPS Endpoints. In particular, they do not currently automate zero-downtime deployment (but you can of course leverage them to architect that yourself).
You can create and manage TCP and TLS Endpoints starting today using Aptible Toolbelt commands:
Read-only access is already available in the Dashboard as well. Read-write access will be available in the Dashboard soon!
Oct 10, 2017
Oct 10, 2017
We’re happy to announce that TCP and TLS Endpoints have left private beta and are now generally available in Enclave!
Compared to Enclave’s other Endpoint type (HTTPS Endpoints), TCP and TLS Endpoints are lower-level primitives that give you more flexibility. For example, you can use TCP or TLS Endpoints to deploy non-HTTP apps on Enclave, or take ownership of TLS termination in your app. One particularly notable use case for healthcare companies is to run a Mirth Connect receiver to ingest HL7 data.
Note that, being lower-level primitives, TCP and TLS Endpoints do not include as many bells and whistles as HTTPS Endpoints. In particular, they do not currently automate zero-downtime deployment (but you can of course leverage them to architect that yourself).
You can create and manage TCP and TLS Endpoints starting today using Aptible Toolbelt commands:
Read-only access is already available in the Dashboard as well. Read-write access will be available in the Dashboard soon!
Oct 10, 2017
Oct 10, 2017
We’re proud to announce that PostgreSQL 10 is now available on Enclave. You can choose PostgreSQL 10 when creating a new database, and it will soon become the default as well:
Upgrading to PostgreSQL 10
If you’d like to upgrade an existing database to PostgreSQL 10, you have two options:
Provision a new PostgreSQL 10 database, then dump the data from your old PostgreSQL database to the new PostgreSQL 10 database. This is the best approach for development databases and non-critical production databases.
Contact support to schedule an in-place upgrade of your database. This is the best approach for critical production databases.
Oct 10, 2017
Oct 10, 2017
We’re proud to announce that PostgreSQL 10 is now available on Enclave. You can choose PostgreSQL 10 when creating a new database, and it will soon become the default as well:
Upgrading to PostgreSQL 10
If you’d like to upgrade an existing database to PostgreSQL 10, you have two options:
Provision a new PostgreSQL 10 database, then dump the data from your old PostgreSQL database to the new PostgreSQL 10 database. This is the best approach for development databases and non-critical production databases.
Contact support to schedule an in-place upgrade of your database. This is the best approach for critical production databases.
Oct 10, 2017
Oct 10, 2017
We’re happy to announce that the Aptible Toolbelt now exposes commands that let you manage App and Database Endpoints:
We’re happy to announce that the Aptible Toolbelt now exposes commands that let you manage App and Database Endpoints:
Oct 10, 2017
Oct 10, 2017
We’re happy to announce that the Aptible Toolbelt now exposes commands that let you manage App and Database Endpoints:
We’re happy to announce that the Aptible Toolbelt now exposes commands that let you manage App and Database Endpoints:
Oct 10, 2017
Oct 5, 2017
Whether you’re operating in a regulated industry or not, periodically reviewing activity on your resources for unexpected and suspicious changes is unquestionably a best practice.
Historically, Enclave has historically allowed you to do so via the “Activity” tab for each App and Database in your account, but at scale, this can be a fairly cumbersome approach.
That is why we are introducing Activity Reports. Activity Reports are CSV documents listing all operations that took place in a given Environment; they are posted on a weekly basis in the Aptible Dashboard.
Using Activity Reports, you get a consolidated view of your team’s activity in your Enclave Environment, including ssh access, database tunnel access, deployments, restarts, configuration changes, and more.
We recommend including periodic review of Activity Reports in your information security procedures.
If you’d like to see a report for yourself, head on over to the Aptible Dashboard, and download the latest report under the “Activity Reports” tab.
Oct 5, 2017
Oct 5, 2017
Whether you’re operating in a regulated industry or not, periodically reviewing activity on your resources for unexpected and suspicious changes is unquestionably a best practice.
Historically, Enclave has historically allowed you to do so via the “Activity” tab for each App and Database in your account, but at scale, this can be a fairly cumbersome approach.
That is why we are introducing Activity Reports. Activity Reports are CSV documents listing all operations that took place in a given Environment; they are posted on a weekly basis in the Aptible Dashboard.
Using Activity Reports, you get a consolidated view of your team’s activity in your Enclave Environment, including ssh access, database tunnel access, deployments, restarts, configuration changes, and more.
We recommend including periodic review of Activity Reports in your information security procedures.
If you’d like to see a report for yourself, head on over to the Aptible Dashboard, and download the latest report under the “Activity Reports” tab.
Oct 5, 2017
Sep 29, 2017
Database Backups can now be restored across different Environments on Enclave. This change lets you easily support workflows that involve restoring backups of production data for analytics or investigation into lower-privileged environments.
To use it, add the --environment flag when running aptible backup:restore:
aptible backup:restore "$BACKUP_ID" --environment "$ENVIRONMENT_HANDLE"
To make sure you don’t accidentally transfer sensitive or regulated data to a non-compliant development environment, this feature ships with an important safeguard: while Backups can be restored across Environments, they cannot be restored across Stacks.
For example, this means data that was stored in a production PHI-ready environment can’t accidentally be restored into a non-PHI-ready development environment.
Sep 29, 2017
Sep 29, 2017
Database Backups can now be restored across different Environments on Enclave. This change lets you easily support workflows that involve restoring backups of production data for analytics or investigation into lower-privileged environments.
To use it, add the --environment flag when running aptible backup:restore:
aptible backup:restore "$BACKUP_ID" --environment "$ENVIRONMENT_HANDLE"
To make sure you don’t accidentally transfer sensitive or regulated data to a non-compliant development environment, this feature ships with an important safeguard: while Backups can be restored across Environments, they cannot be restored across Stacks.
For example, this means data that was stored in a production PHI-ready environment can’t accidentally be restored into a non-PHI-ready development environment.
Sep 29, 2017
Sep 21, 2017
Originally, Enclave Log Drains only captured logs from app containers; after adding support for Database logging, we’re happy to announce that SSH Sessions logs are now available in your Enclave Log Drains as well! As of this week, you can now configure Log Drains to receive logs from SSH Sessions.
This new feature makes it easy for you to meet compliance requirements mandating that all access to production data be logged, without compromising your ability to perform maintenance tasks or respond to urgent incidents by accessing your production environment via aptible ssh.
How does it work?
SSH Session logging functions similarly to App and Database logging: all the output from ephemeral containers is captured and routed to a Log Drain. This output is pretty much exactly what an end-user would see on their own screen, which means:
Your Log Drains will often also receive what users are typing in, since most shells and consoles echo the user’s input back to them.
If you’re prompting the user for a password using a safe password prompt that does not write back anything, nothing will be sent to the Log Drain either. That prevents you from leaking your passwords to your logging provider.
However, unlike App and Database logs, SSH Session logs include extra metadata about the user running the SSH session if your Log Drain supports it, including their email and user name. Review the documentation for more information.
How do I use this?
Add a new Log Drain in your environment, and make sure to select the option to drain logs from ephemeral sessions (if you already have other Log Drains set up for Apps and Databases, you’ll probably want to un-select those options to avoid double-logging).
Sep 21, 2017
Sep 21, 2017
Originally, Enclave Log Drains only captured logs from app containers; after adding support for Database logging, we’re happy to announce that SSH Sessions logs are now available in your Enclave Log Drains as well! As of this week, you can now configure Log Drains to receive logs from SSH Sessions.
This new feature makes it easy for you to meet compliance requirements mandating that all access to production data be logged, without compromising your ability to perform maintenance tasks or respond to urgent incidents by accessing your production environment via aptible ssh.
How does it work?
SSH Session logging functions similarly to App and Database logging: all the output from ephemeral containers is captured and routed to a Log Drain. This output is pretty much exactly what an end-user would see on their own screen, which means:
Your Log Drains will often also receive what users are typing in, since most shells and consoles echo the user’s input back to them.
If you’re prompting the user for a password using a safe password prompt that does not write back anything, nothing will be sent to the Log Drain either. That prevents you from leaking your passwords to your logging provider.
However, unlike App and Database logs, SSH Session logs include extra metadata about the user running the SSH session if your Log Drain supports it, including their email and user name. Review the documentation for more information.
How do I use this?
Add a new Log Drain in your environment, and make sure to select the option to drain logs from ephemeral sessions (if you already have other Log Drains set up for Apps and Databases, you’ll probably want to un-select those options to avoid double-logging).
Sep 21, 2017
Sep 11, 2017
Scaling apps to zero containers on Enclave nows redirects your traffic to Enclave’s error-page server (Brickwall) before shutting down app containers.
Concretely, this means the failover from your app to your Custom Maintenance Page (if you configured one) will happen smoothly: clients will never see a generic error page.
For comparison, if you scaled down to zero containers before this change, the failover would happen automatically, but only once our monitoring detected your app was down. Often, this resulted in about a minute of latency during which clients would indeed see a generic error page.
Sep 11, 2017
Sep 11, 2017
Scaling apps to zero containers on Enclave nows redirects your traffic to Enclave’s error-page server (Brickwall) before shutting down app containers.
Concretely, this means the failover from your app to your Custom Maintenance Page (if you configured one) will happen smoothly: clients will never see a generic error page.
For comparison, if you scaled down to zero containers before this change, the failover would happen automatically, but only once our monitoring detected your app was down. Often, this resulted in about a minute of latency during which clients would indeed see a generic error page.
Sep 11, 2017
Sep 11, 2017
For more information, review our documentation on Implicit Services.
For more information, review our documentation on Implicit Services.
Sep 11, 2017
Sep 11, 2017
For more information, review our documentation on Implicit Services.
For more information, review our documentation on Implicit Services.
Sep 11, 2017
Sep 11, 2017
The Dashboard now provides CPU utilization metrics for apps and databases. This change gives you more visibility into the resources used by your containers, and can help you make better scaling decisions.
As you review CPU utilization for your apps, keep in mind that:
(i.e. non-production), but you can opt-in to CPU limits for production stacks via a support request.
Containers are allocated 1/4th of a CPU thread per GB of RAM. For example, a 1 GB container should use no more than 25% of a CPU thread, while a 4 GB container should use no more than 100%.
For more information, review our documentation on CPU limits.
Sep 11, 2017
Sep 11, 2017
The Dashboard now provides CPU utilization metrics for apps and databases. This change gives you more visibility into the resources used by your containers, and can help you make better scaling decisions.
As you review CPU utilization for your apps, keep in mind that:
(i.e. non-production), but you can opt-in to CPU limits for production stacks via a support request.
Containers are allocated 1/4th of a CPU thread per GB of RAM. For example, a 1 GB container should use no more than 25% of a CPU thread, while a 4 GB container should use no more than 100%.
For more information, review our documentation on CPU limits.
Sep 11, 2017
Jun 22, 2017
We’re proud to announce that as of this week, Enclave automatically restarts application and database containers when they crash.
Thanks to this new feature, you no longer need to use process supervisors or shell while loops in your containers to ensure that they stay up no matter what: Enclave will take care of that for you.
How does it work?
Container Recovery functions similarly to Memory Management: if one of your containers crashes (or, in the case of Memory Management, exceeds its memory allocation), Enclave automatically restores your container to a pristine state, then restarts it.
You don’t have to do anything, it just works.
Why does this matter?
Enclave provides a number of features to ensure high-availability on your apps at the infrastructure level, including:
Automatically distributing your app containers across instances located in distinct EC2 availability zones.
Implementing health checks to automatically divert traffic away from crashed app containers.
These controls effectively protect you against infrastructure failures, but they can’t help you when your app containers all crash due to a bug affecting your app itself. Here are a few examples of the latter, which we’ve seen affect customer apps deployed on Enclave, and which are now mitigated by Container Recovery:
Apps that crash when their database connection is interrupted due to temporary network unavailability, a timeout, or simply downtime (for example, during a database resizing operation).
Background processors that crash. For example, all your Sidekiq workers exiting with an irrecoverable error, such as a segfault caused by a faulty native dependency.
If you’d like to learn more about this feature, please find a full overview of Container Recovery in the Enclave documentation.
Jun 22, 2017
Jun 22, 2017
We’re proud to announce that as of this week, Enclave automatically restarts application and database containers when they crash.
Thanks to this new feature, you no longer need to use process supervisors or shell while loops in your containers to ensure that they stay up no matter what: Enclave will take care of that for you.
How does it work?
Container Recovery functions similarly to Memory Management: if one of your containers crashes (or, in the case of Memory Management, exceeds its memory allocation), Enclave automatically restores your container to a pristine state, then restarts it.
You don’t have to do anything, it just works.
Why does this matter?
Enclave provides a number of features to ensure high-availability on your apps at the infrastructure level, including:
Automatically distributing your app containers across instances located in distinct EC2 availability zones.
Implementing health checks to automatically divert traffic away from crashed app containers.
These controls effectively protect you against infrastructure failures, but they can’t help you when your app containers all crash due to a bug affecting your app itself. Here are a few examples of the latter, which we’ve seen affect customer apps deployed on Enclave, and which are now mitigated by Container Recovery:
Apps that crash when their database connection is interrupted due to temporary network unavailability, a timeout, or simply downtime (for example, during a database resizing operation).
Background processors that crash. For example, all your Sidekiq workers exiting with an irrecoverable error, such as a segfault caused by a faulty native dependency.
If you’d like to learn more about this feature, please find a full overview of Container Recovery in the Enclave documentation.
Jun 22, 2017
Jun 13, 2017
We’re proud to announce that you can now deploy apps on Enclave directly from a Docker image, bypassing Enclave’s traditional git-based deployment process.
With this feature, you can easily use the same images for deployment on Enclave and test / dev via other Docker-based tools such as Docker Compose or Kubernetes. And, if you’re already using Docker for your development workflow but haven’t adopted Enclave yet, it’s now much easier for you to take the platform for a spin.
How does it work?
Direct docker image deployments on Enclave are done via the CLI interface. Here’s an example.
To deploy Docker’s official “hello-world” image to an app called “my-hello-world-app” on Enclave, you’d use this command:
aptible deploy --app my-hello-world-app --docker-image hello-world
And if your app follows the 12-factor configuration guidelines and uses the environment for configuration, you can include arbitrary environment variables for your app when running aptible deploy:
aptible deploy --app my-enclave-app --docker-image quay.io/my-org/my-app \ DATABASE_URL=postgresql://...
Why use it?
First off, if you’re currently using Enclave’s git-based deployment workflow, you can continue using that: it’s not going away! That being said, there are a few reasons why you might want to look at direct Docker image deploy as an alternative.
First, you might like more control over your Docker image build process. Indeed, when you deploy via git, Enclave follows a fairly opinionated build process:
The Docker build context is your git repository.
Enclave injects a .aptible.env file in your repository for you to access environment variables.
Enclave uses the Dockerfile from the root of your git repository.
This works just fine for a majority of apps, but if that’s not your case, use direct Docker image deploy for complete control over your build process, and make adjustments as needed. For example, you could inject private dependencies in your build context, leverage Docker build arguments, or use a different Dockerfile.
Other reasons for using this feature include:
You’re already building Docker images to use with other tools. Use this direct Docker image deploy feature to unify your deployments around a single build.
You’re using a public Docker image that’s available on the Docker hub. Use direct Docker image deploy so you don’t have to rebuild it from scratch.
If you’d like to learn more about this new feature, head for the documentation! And, as usual, let us know if you have any feedback.
Note: Astute readers will note that you’ve been able to deploy apps on Enclave directly from a Docker image for some time, but we did rework the feature to make it much easier to use. Specifically, here’s what changed:
Procfiles and git repositories are now optional: Enclave will use your Docker image’s CMD if you don’t have a Procfile.
You no longer need to run aptible config:set followed by aptible rebuild to deploy. Instead, you can do everything in one operation with aptible deploy.
Jun 13, 2017
Jun 13, 2017
We’re proud to announce that you can now deploy apps on Enclave directly from a Docker image, bypassing Enclave’s traditional git-based deployment process.
With this feature, you can easily use the same images for deployment on Enclave and test / dev via other Docker-based tools such as Docker Compose or Kubernetes. And, if you’re already using Docker for your development workflow but haven’t adopted Enclave yet, it’s now much easier for you to take the platform for a spin.
How does it work?
Direct docker image deployments on Enclave are done via the CLI interface. Here’s an example.
To deploy Docker’s official “hello-world” image to an app called “my-hello-world-app” on Enclave, you’d use this command:
aptible deploy --app my-hello-world-app --docker-image hello-world
And if your app follows the 12-factor configuration guidelines and uses the environment for configuration, you can include arbitrary environment variables for your app when running aptible deploy:
aptible deploy --app my-enclave-app --docker-image quay.io/my-org/my-app \ DATABASE_URL=postgresql://...
Why use it?
First off, if you’re currently using Enclave’s git-based deployment workflow, you can continue using that: it’s not going away! That being said, there are a few reasons why you might want to look at direct Docker image deploy as an alternative.
First, you might like more control over your Docker image build process. Indeed, when you deploy via git, Enclave follows a fairly opinionated build process:
The Docker build context is your git repository.
Enclave injects a .aptible.env file in your repository for you to access environment variables.
Enclave uses the Dockerfile from the root of your git repository.
This works just fine for a majority of apps, but if that’s not your case, use direct Docker image deploy for complete control over your build process, and make adjustments as needed. For example, you could inject private dependencies in your build context, leverage Docker build arguments, or use a different Dockerfile.
Other reasons for using this feature include:
You’re already building Docker images to use with other tools. Use this direct Docker image deploy feature to unify your deployments around a single build.
You’re using a public Docker image that’s available on the Docker hub. Use direct Docker image deploy so you don’t have to rebuild it from scratch.
If you’d like to learn more about this new feature, head for the documentation! And, as usual, let us know if you have any feedback.
Note: Astute readers will note that you’ve been able to deploy apps on Enclave directly from a Docker image for some time, but we did rework the feature to make it much easier to use. Specifically, here’s what changed:
Procfiles and git repositories are now optional: Enclave will use your Docker image’s CMD if you don’t have a Procfile.
You no longer need to run aptible config:set followed by aptible rebuild to deploy. Instead, you can do everything in one operation with aptible deploy.
Jun 13, 2017
May 23, 2017
We’re proud to announce that you can now resize both the container and disk footprints of your Enclave databases from the Dashboard or CLI. For new databases, you can also configure the container size from day 1, whereas it previously defaulted to 1GB RAM.
Using this new feature, you can easily scale your database up as your traffic grows or when you’re about to run out of disk space. To that end, check out Container Metrics, which provides a real time view into your databases’ RAM and disk usage. Aptible Support will also notify you if your disk usage reaches 90%.
How does database scaling work?
There are two ways you can resize your database.
First, you can do so via the Dashboard. Just click modify next to the container or disk size, and proceed.
Second, you can do so via the CLI. For example, to scale a database named “demo-database” to a 2GB RAM container with 30 GB disk, you’d use:
aptible db:restart demo-database --container-size 2048 --disk-size 30
And under the hood?
To provide truly elastic database capacity, Enclave relies on AWS EC2 and EBS to support your database containers and volumes. As an Enclave end-user, this means two things for you.
First, it means resizing your database container may take a little while (on the order of 30 minutes) if we need to provision new EC2 capacity to support it. This will often be the case if you’re scaling to a 4GB or 7GB container, less so if you’re scaling to 512MB, 1GB, or 2GB.
However, the good news is that Enclave automatically minimizes downtime when resizing a database, so even if the resize operation takes 30 minutes to complete because new capacity was required, your database will only be unavailable for a few short minutes.
Second, is means resizing your database disk is consistently fast. Even for very large disks, you can expect a disk resize to complete within minutes.
If you have any questions or comments, please let us know at support@aptible.com. Thanks!
May 23, 2017
May 23, 2017
We’re proud to announce that you can now resize both the container and disk footprints of your Enclave databases from the Dashboard or CLI. For new databases, you can also configure the container size from day 1, whereas it previously defaulted to 1GB RAM.
Using this new feature, you can easily scale your database up as your traffic grows or when you’re about to run out of disk space. To that end, check out Container Metrics, which provides a real time view into your databases’ RAM and disk usage. Aptible Support will also notify you if your disk usage reaches 90%.
How does database scaling work?
There are two ways you can resize your database.
First, you can do so via the Dashboard. Just click modify next to the container or disk size, and proceed.
Second, you can do so via the CLI. For example, to scale a database named “demo-database” to a 2GB RAM container with 30 GB disk, you’d use:
aptible db:restart demo-database --container-size 2048 --disk-size 30
And under the hood?
To provide truly elastic database capacity, Enclave relies on AWS EC2 and EBS to support your database containers and volumes. As an Enclave end-user, this means two things for you.
First, it means resizing your database container may take a little while (on the order of 30 minutes) if we need to provision new EC2 capacity to support it. This will often be the case if you’re scaling to a 4GB or 7GB container, less so if you’re scaling to 512MB, 1GB, or 2GB.
However, the good news is that Enclave automatically minimizes downtime when resizing a database, so even if the resize operation takes 30 minutes to complete because new capacity was required, your database will only be unavailable for a few short minutes.
Second, is means resizing your database disk is consistently fast. Even for very large disks, you can expect a disk resize to complete within minutes.
If you have any questions or comments, please let us know at support@aptible.com. Thanks!
May 23, 2017
May 16, 2017
We’re proud to announce that you can now create and manage external database endpoints via the Enclave dashboard. External endpoints are useful to grant third parties access to data stored in Enclave databases for purposes such as analytics and ETL (without an endpoint, your database is firewalled off and inaccessible from the public internet). To set up a new endpoint for one of your databases, simply navigate to the Endpoints tab for this database and follow the instructions. Like their app counterparts, database endpoints support IP filtering, so you can ensure only trusted third parties have access to your database:
Note that we’ve historically supported database endpoints via support requests before introducing this feature. If you had been using a database endpoint before we introduced this feature, it was automatically migrated and you’ll be able to manage it via the Dashboard going forward!
May 16, 2017
May 16, 2017
We’re proud to announce that you can now create and manage external database endpoints via the Enclave dashboard. External endpoints are useful to grant third parties access to data stored in Enclave databases for purposes such as analytics and ETL (without an endpoint, your database is firewalled off and inaccessible from the public internet). To set up a new endpoint for one of your databases, simply navigate to the Endpoints tab for this database and follow the instructions. Like their app counterparts, database endpoints support IP filtering, so you can ensure only trusted third parties have access to your database:
Note that we’ve historically supported database endpoints via support requests before introducing this feature. If you had been using a database endpoint before we introduced this feature, it was automatically migrated and you’ll be able to manage it via the Dashboard going forward!
May 16, 2017
Mar 23, 2017
We’re happy to announce that Enclave now leverages AWS “Elastic Volumes” to resize database storage. This feature was released a little over a month ago by AWS, and lets us grow EBS volumes without the need to snapshot.
For Enclave users, this means resizing your database volume is faster than it’s ever been: it now takes just minutes on average, and scales very well to larger volumes.
For comparison, before the introduction of Elastic Volumes, the only way to resize an EBS volume on AWS was to snapshot the volume then recreate it. However, this approach scaled poorly as you stored more data: creating a snapshot might take a few minutes for small volumes, but several hours for active, large 1TB+ volumes!
Now, with Elastic Volume support, resizing always results in less downtime, even if you end up scaling faster than you anticipated.
If you need to resize your database volume, contact Aptible Support and we’ll coordinate a time with you to perform the resize. Our operations team may also reach out to you to do so if our monitoring indicates that you’re about to run out disk space. We plan to release self-serve resizing sometime down the road, as well.
As usual, let us know if you have any questions or feedback!
Mar 23, 2017
Mar 23, 2017
We’re happy to announce that Enclave now leverages AWS “Elastic Volumes” to resize database storage. This feature was released a little over a month ago by AWS, and lets us grow EBS volumes without the need to snapshot.
For Enclave users, this means resizing your database volume is faster than it’s ever been: it now takes just minutes on average, and scales very well to larger volumes.
For comparison, before the introduction of Elastic Volumes, the only way to resize an EBS volume on AWS was to snapshot the volume then recreate it. However, this approach scaled poorly as you stored more data: creating a snapshot might take a few minutes for small volumes, but several hours for active, large 1TB+ volumes!
Now, with Elastic Volume support, resizing always results in less downtime, even if you end up scaling faster than you anticipated.
If you need to resize your database volume, contact Aptible Support and we’ll coordinate a time with you to perform the resize. Our operations team may also reach out to you to do so if our monitoring indicates that you’re about to run out disk space. We plan to release self-serve resizing sometime down the road, as well.
As usual, let us know if you have any questions or feedback!
Mar 23, 2017
Mar 21, 2017
We’re proud to announce that Aptible now supports hardware Security Keys as a second authentication factor! Specifically, Aptible now supports devices compliant with the FIDO Universal Second Factor (U2F) standard.
U2F Security Keys can be securely used across multiple accounts, and are rapidly gaining adoption: Google, GitHub, Dropbox, and many others now support U2F Security Keys.
Convenience and Security: Pick Both!
There are two main reasons to use a Security Key with your Aptible account: increased convenience and better security.
With a Security Key, you just touch the key to authenticate. No more fumbling for your phone.
But Security Keys also help better protect against phishing, a common and sometimes dangerous attack.
Security Keys protect your Aptible account against phishing
Token-based 2FA does a good job at protecting your account against attackers who only learn your password, but it remains vulnerable to phishing: an attacker can trick you into providing your token and try to use it before it expires. Service providers can’t reliably tell the difference between the attacker’s request and a legitimate one coming from you.
Security keys offer much stronger protection against phishing. Here’s how:
When you try to log in using a Security Key, Aptible provides a unique challenge, and your Security Key responds a signed authentication response unique to that challenge. But unlike a 6-digit 2FA token, the Security Key’s response includes useful metadata Aptible can leverage to protect your account:
The origin your browser was pointed at when you signed this response. If you’re being phished, this will be the attacker’s website, whereas if you’re actually logging in to Aptible, it’ll be dashboard.aptible.com.
A device-specific response counter that your Security Key is responsible for increasing monotonically when it generates an authentication response. If your Security Key was cloned by an advanced attacker with physical access, inconsistent counter values may reveal their misdeed.
Once your Security Key has sent the response, Aptible verifies it as follows:
The response must be signed by a Security Key associated with your account. Naturally, the signature must be valid.
The response must have been generated for dashboard.aptible.com. This protects you against phishing.
The response must be for a challenge Aptible issued recently, and that challenge must not have been used before. This protects you against replay attacks.
The response must include a counter that’s greater that any count we’ve seen before for this Security Key. This protects you — to some extent — against device cloning.
How do I use U2F with my Aptible account?
First, you’ll need to purchase an FIDO U2F-compliant device from a trusted vendor. The Aptible team uses Yubikeys, but there exist a number of other vendors.
You’ll also need to make sure your browser supports U2F Security Keys. Currently, only Chrome and Opera offer such support, but other browser vendors are working on adding support (U2F support is on the Firefox roadmap for Q2 2017).
Once you’re done, navigate to your account settings, make sure 2FA is enabled, click on “Add a new Security Key”, and follow the instructions:
That’s it! Next time you attempt to log in, you’ll be prompted to touch your Security Key as an alternative to entering a 2FA token.
Can I stop using token-based 2-Factor Authentication altogether?
No: U2F Security Keys can be added as additional second factors on your account, but you can’t disable token-based authentication.
The reason for this is that U2F Security Keys aren’t supported everywhere yet, so you may need to occasionally fallback to a token to log in: not all browsers support them (only Chrome and Opera do at this time), and neither does the Aptible CLI. This may evolve over time, so it’s conceivable that we’ll eventually let you use U2F only.
As usual, let us know if you have any questions or feedback!
Mar 21, 2017
Mar 21, 2017
We’re proud to announce that Aptible now supports hardware Security Keys as a second authentication factor! Specifically, Aptible now supports devices compliant with the FIDO Universal Second Factor (U2F) standard.
U2F Security Keys can be securely used across multiple accounts, and are rapidly gaining adoption: Google, GitHub, Dropbox, and many others now support U2F Security Keys.
Convenience and Security: Pick Both!
There are two main reasons to use a Security Key with your Aptible account: increased convenience and better security.
With a Security Key, you just touch the key to authenticate. No more fumbling for your phone.
But Security Keys also help better protect against phishing, a common and sometimes dangerous attack.
Security Keys protect your Aptible account against phishing
Token-based 2FA does a good job at protecting your account against attackers who only learn your password, but it remains vulnerable to phishing: an attacker can trick you into providing your token and try to use it before it expires. Service providers can’t reliably tell the difference between the attacker’s request and a legitimate one coming from you.
Security keys offer much stronger protection against phishing. Here’s how:
When you try to log in using a Security Key, Aptible provides a unique challenge, and your Security Key responds a signed authentication response unique to that challenge. But unlike a 6-digit 2FA token, the Security Key’s response includes useful metadata Aptible can leverage to protect your account:
The origin your browser was pointed at when you signed this response. If you’re being phished, this will be the attacker’s website, whereas if you’re actually logging in to Aptible, it’ll be dashboard.aptible.com.
A device-specific response counter that your Security Key is responsible for increasing monotonically when it generates an authentication response. If your Security Key was cloned by an advanced attacker with physical access, inconsistent counter values may reveal their misdeed.
Once your Security Key has sent the response, Aptible verifies it as follows:
The response must be signed by a Security Key associated with your account. Naturally, the signature must be valid.
The response must have been generated for dashboard.aptible.com. This protects you against phishing.
The response must be for a challenge Aptible issued recently, and that challenge must not have been used before. This protects you against replay attacks.
The response must include a counter that’s greater that any count we’ve seen before for this Security Key. This protects you — to some extent — against device cloning.
How do I use U2F with my Aptible account?
First, you’ll need to purchase an FIDO U2F-compliant device from a trusted vendor. The Aptible team uses Yubikeys, but there exist a number of other vendors.
You’ll also need to make sure your browser supports U2F Security Keys. Currently, only Chrome and Opera offer such support, but other browser vendors are working on adding support (U2F support is on the Firefox roadmap for Q2 2017).
Once you’re done, navigate to your account settings, make sure 2FA is enabled, click on “Add a new Security Key”, and follow the instructions:
That’s it! Next time you attempt to log in, you’ll be prompted to touch your Security Key as an alternative to entering a 2FA token.
Can I stop using token-based 2-Factor Authentication altogether?
No: U2F Security Keys can be added as additional second factors on your account, but you can’t disable token-based authentication.
The reason for this is that U2F Security Keys aren’t supported everywhere yet, so you may need to occasionally fallback to a token to log in: not all browsers support them (only Chrome and Opera do at this time), and neither does the Aptible CLI. This may evolve over time, so it’s conceivable that we’ll eventually let you use U2F only.
As usual, let us know if you have any questions or feedback!
Mar 21, 2017
Mar 14, 2017
We’re happy to announce that Managed HTTPS is now available on Enclave for Internal Endpoints (in addition to External Endpoints, which were supported from day 1).
This means your internal-facing apps can now enjoy the benefits of Managed HTTPS Endpoints:
Automated certificate provisioning
Automated certificate renewals
Monitoring to detect problems with renewals and alert you
Getting Started
When you create a new Managed HTTPS Endpoint, the Aptible Dashboard will indicate which CNAME records you need to create via your DNS provider in order for Enclave to provision and renew certificates on your behalf (you’ll see one record for internal Endpoints, and two for external Endpoints — read on to understand why):
For existing Managed HTTPS Endpoints, the Dashboard lets you review your current DNS configuration, so you can easily review whether everything is configured properly:
If your Endpoint DNS records are misconfigured and Enclave is unable to automatically renew the certificate, Aptible support staff will contact you.
How it works
Fundamentally, Managed HTTPS relies on Let’s Encrypt to provision and renew certificates from your apps. Let’s Encrypt offers multiple ways to verify control of a domain, but they all boil down to the same process:
We notify Let’s Encrypt that we’d like to provision a new certificate for your domain
Let’s Encrypt provides us with a set of challenges to try and prove we control the domain
We fulfill one of the challenges, and get the certificate
There’s a total of 3 types of challenges supported in Let’s Encrypt, and we now use 2 of them:
HTTP Challenges
For HTTP challenges, Let’s Encrypt provides us with an arbitrary token and a URL under the domain we’re attempting to verify, and expects us to serve the token when it makes a request to that URL.
The token is a random string of data, and the URL looks like this:
http://$YOUR_DOMAIN/.well-known/acme-challenge/$SOME_RANDOM_STRING
We’ve supported HTTP challenges since day one: when Let’s Encrypt makes its request to your app hosted on Enclave (i.e. assuming you created a CNAME from $YOUR_DOMAIN to your Enclave Endpoint), Enclave intercepts the requests, serves the token, and thus validates control of the domain.
Obviously, this only works if Let’s Encrypt can connect to your domain from the Internet. This becomes a problem for Internal Endpoints or Endpoints with IP Filtering, since Let’s Encrypt can’t connect to them!
That’s why we’ve now added support for DNS Challenges as well.
DNS Challenges
DNS challenges are comparatively simpler than HTTP challenges. Here again, Let’s Encrypt provides an arbitrary token, but this time we’re expected to serve that token as a TXT record in DNS under the following name:
_acme-challenge.$YOUR_DOMAIN.
Now, there’s one little hiccup here: we don’t control _acme-challenge.$YOUR_DOMAIN: you do! To make this work, you need to tell Let’s Encrypt that you trust us to provision and renew certificates on your behalf.
To do so, you simply need to create a CNAME via your DNS provider from that record Let’s Encrypt is interested in to another record controlled by Enclave. To make this easy for you, the Dashboard will instruct you to do so, and give you the exact record to create.
And of course, the upside of using a DNS challenge is that unlike a HTTP challenge, it works for Internal Endpoints and Endpoints with IP Filtering!
Note that DNS challenges work for both External and Internal Endpoints, which is why the Dashboard will always prompt you to create the corresponding record (whereas it’ll only prompt you to create the record required for HTTP verification for External Endpoints).
As usual, let us know if you have any questions or feedback!
Mar 14, 2017
Mar 14, 2017
We’re happy to announce that Managed HTTPS is now available on Enclave for Internal Endpoints (in addition to External Endpoints, which were supported from day 1).
This means your internal-facing apps can now enjoy the benefits of Managed HTTPS Endpoints:
Automated certificate provisioning
Automated certificate renewals
Monitoring to detect problems with renewals and alert you
Getting Started
When you create a new Managed HTTPS Endpoint, the Aptible Dashboard will indicate which CNAME records you need to create via your DNS provider in order for Enclave to provision and renew certificates on your behalf (you’ll see one record for internal Endpoints, and two for external Endpoints — read on to understand why):
For existing Managed HTTPS Endpoints, the Dashboard lets you review your current DNS configuration, so you can easily review whether everything is configured properly:
If your Endpoint DNS records are misconfigured and Enclave is unable to automatically renew the certificate, Aptible support staff will contact you.
How it works
Fundamentally, Managed HTTPS relies on Let’s Encrypt to provision and renew certificates from your apps. Let’s Encrypt offers multiple ways to verify control of a domain, but they all boil down to the same process:
We notify Let’s Encrypt that we’d like to provision a new certificate for your domain
Let’s Encrypt provides us with a set of challenges to try and prove we control the domain
We fulfill one of the challenges, and get the certificate
There’s a total of 3 types of challenges supported in Let’s Encrypt, and we now use 2 of them:
HTTP Challenges
For HTTP challenges, Let’s Encrypt provides us with an arbitrary token and a URL under the domain we’re attempting to verify, and expects us to serve the token when it makes a request to that URL.
The token is a random string of data, and the URL looks like this:
http://$YOUR_DOMAIN/.well-known/acme-challenge/$SOME_RANDOM_STRING
We’ve supported HTTP challenges since day one: when Let’s Encrypt makes its request to your app hosted on Enclave (i.e. assuming you created a CNAME from $YOUR_DOMAIN to your Enclave Endpoint), Enclave intercepts the requests, serves the token, and thus validates control of the domain.
Obviously, this only works if Let’s Encrypt can connect to your domain from the Internet. This becomes a problem for Internal Endpoints or Endpoints with IP Filtering, since Let’s Encrypt can’t connect to them!
That’s why we’ve now added support for DNS Challenges as well.
DNS Challenges
DNS challenges are comparatively simpler than HTTP challenges. Here again, Let’s Encrypt provides an arbitrary token, but this time we’re expected to serve that token as a TXT record in DNS under the following name:
_acme-challenge.$YOUR_DOMAIN.
Now, there’s one little hiccup here: we don’t control _acme-challenge.$YOUR_DOMAIN: you do! To make this work, you need to tell Let’s Encrypt that you trust us to provision and renew certificates on your behalf.
To do so, you simply need to create a CNAME via your DNS provider from that record Let’s Encrypt is interested in to another record controlled by Enclave. To make this easy for you, the Dashboard will instruct you to do so, and give you the exact record to create.
And of course, the upside of using a DNS challenge is that unlike a HTTP challenge, it works for Internal Endpoints and Endpoints with IP Filtering!
Note that DNS challenges work for both External and Internal Endpoints, which is why the Dashboard will always prompt you to create the corresponding record (whereas it’ll only prompt you to create the record required for HTTP verification for External Endpoints).
As usual, let us know if you have any questions or feedback!
Mar 14, 2017
Feb 21, 2017
We’re proud to announce that as of this week, Enclave Endpoints support IP filtering. Using this new feature, you can restrict access to apps hosted on Enclave to a set of whitelisted IP addresses or networks and block other incoming incoming traffic.
Use Cases
While IP filtering is no substitute for strong authentication, this feature is useful to:
Further lock down access to sensitive apps and interfaces, such as admin dashboards or third party apps you’re hosting on Aptible for internal use only (e.g. Kibana, Sentry).
Restrict access to your apps and APIs to a set of trusted customers or data partners.
And if you’re hosting development apps on Aptible, IP filtering can also help you make sure no one outside your company can view your latest and greatest before you’re ready to release it the world.
Note that IP filtering only applies to Endpoints (i.e. traffic directed to your app), not to aptible ssh, aptible logs, and other backend access functionality provided by the Aptible CLI (this access is secured by strong mutual authentication, as we covered in our Q1 2017 webinar).
Getting Started with IP Filtering
IP filtering is configured via the Aptible Dashboard on a per-Endpoint basis.
You can enable it when creating a new Endpoint, or after the fact for an existing Endpoint by editing it.
Enjoy! As usual, let us know if you have any feedback or questions!
Feb 21, 2017
Feb 21, 2017
We’re proud to announce that as of this week, Enclave Endpoints support IP filtering. Using this new feature, you can restrict access to apps hosted on Enclave to a set of whitelisted IP addresses or networks and block other incoming incoming traffic.
Use Cases
While IP filtering is no substitute for strong authentication, this feature is useful to:
Further lock down access to sensitive apps and interfaces, such as admin dashboards or third party apps you’re hosting on Aptible for internal use only (e.g. Kibana, Sentry).
Restrict access to your apps and APIs to a set of trusted customers or data partners.
And if you’re hosting development apps on Aptible, IP filtering can also help you make sure no one outside your company can view your latest and greatest before you’re ready to release it the world.
Note that IP filtering only applies to Endpoints (i.e. traffic directed to your app), not to aptible ssh, aptible logs, and other backend access functionality provided by the Aptible CLI (this access is secured by strong mutual authentication, as we covered in our Q1 2017 webinar).
Getting Started with IP Filtering
IP filtering is configured via the Aptible Dashboard on a per-Endpoint basis.
You can enable it when creating a new Endpoint, or after the fact for an existing Endpoint by editing it.
Enjoy! As usual, let us know if you have any feedback or questions!
Feb 21, 2017
Feb 13, 2017
We’re happy to announce that Aptible Log Drains now provide more flexible configuration, making it much easier to forward your Aptible logs to two logging providers that are becoming increasingly popular with Aptible customers (in large part because they sign BAAs):
For Logentries, you can now use token-based logging. This makes configuration much, much easier than before: create a new Token TCP Log in Logentries then copy the Logging Token you’re provided with in Aptible, and you’re done!
For Sumo Logic, we now support full HTTPS URLs. Here again, this means setup is greatly simplified: all you need to do is create a new Hosted HTTP Collector in Sumo Logic, then copy the URL you’re provided with in Aptible.
Enjoy! As usual, if you have any questions or feedback, feel free to contact us.
Feb 13, 2017
Feb 13, 2017
We’re happy to announce that Aptible Log Drains now provide more flexible configuration, making it much easier to forward your Aptible logs to two logging providers that are becoming increasingly popular with Aptible customers (in large part because they sign BAAs):
For Logentries, you can now use token-based logging. This makes configuration much, much easier than before: create a new Token TCP Log in Logentries then copy the Logging Token you’re provided with in Aptible, and you’re done!
For Sumo Logic, we now support full HTTPS URLs. Here again, this means setup is greatly simplified: all you need to do is create a new Hosted HTTP Collector in Sumo Logic, then copy the URL you’re provided with in Aptible.
Enjoy! As usual, if you have any questions or feedback, feel free to contact us.
Feb 13, 2017
Feb 13, 2017
Until recently, Aptible has used AES-192 for disk encryption, but as of last week, Aptible databases (and their backups) now default to AES-256 instead.
While there is no security concern whatsoever regarding AES-192 as an encryption standard, it has become increasingly common for Aptible customers to have their own partners request 256-bit encryption everywhere from a compliance perspective, which is why we’re making this change.
If you’re curious to know which encryption algorithm is used for a given database, you can find that information on the Dashboard page for the database in question (along with the disk size and database credentials).
Feb 13, 2017
Feb 13, 2017
Until recently, Aptible has used AES-192 for disk encryption, but as of last week, Aptible databases (and their backups) now default to AES-256 instead.
While there is no security concern whatsoever regarding AES-192 as an encryption standard, it has become increasingly common for Aptible customers to have their own partners request 256-bit encryption everywhere from a compliance perspective, which is why we’re making this change.
If you’re curious to know which encryption algorithm is used for a given database, you can find that information on the Dashboard page for the database in question (along with the disk size and database credentials).
Feb 13, 2017
Feb 13, 2017
As of last week; ALB Endpoints respect the SSL_PROTOCOLS_OVERRIDE app configuration variable, which was — until now — only applicable to ELB Endpoints.
In a nutshell, setting SSL_PROTOCOLS_OVERRIDE lets you customize the protocols exposed by your Endpoint for encrypted traffic.
For example, if you have a regulatory requirement to only expose TLSv1.2, you can do so using the following command (via the Aptible CLI):
aptible config:set FORCE_SSL=true "SSL_PROTOCOLS_OVERRIDE=TLSv1.2" --app my-app
Note that by default (i.e. if you don’t set SSL_PROTOCOLS_OVERRIDE), Aptible Endpoints accept connections over TLSv1, TLSv1.1, and TLSv1.2. This configuration will evolve over time as best practices in the industry continue to evolve.
You can learn more about the SSL_PROTOCOLS_OVERRIDE configuration variable (and other variables available) on our support website: How can I modify the way my app handles SSL?
Feb 13, 2017
Feb 13, 2017
As of last week; ALB Endpoints respect the SSL_PROTOCOLS_OVERRIDE app configuration variable, which was — until now — only applicable to ELB Endpoints.
In a nutshell, setting SSL_PROTOCOLS_OVERRIDE lets you customize the protocols exposed by your Endpoint for encrypted traffic.
For example, if you have a regulatory requirement to only expose TLSv1.2, you can do so using the following command (via the Aptible CLI):
aptible config:set FORCE_SSL=true "SSL_PROTOCOLS_OVERRIDE=TLSv1.2" --app my-app
Note that by default (i.e. if you don’t set SSL_PROTOCOLS_OVERRIDE), Aptible Endpoints accept connections over TLSv1, TLSv1.1, and TLSv1.2. This configuration will evolve over time as best practices in the industry continue to evolve.
You can learn more about the SSL_PROTOCOLS_OVERRIDE configuration variable (and other variables available) on our support website: How can I modify the way my app handles SSL?
Feb 13, 2017
Jan 19, 2017
We’re proud to announce that as of today, new Redis databases provisioned on Aptible Enclave support SSL/TLS in addition to the regular Redis protocol. Because both AWS and Aptible require that you encrypt HIPAA Protected Health Information in transit, even within a private, dedicated Enclave stack, starting today you can now use Redis to store and process PHI on Enclave.
How does it work?
Redis doesn’t support SSL natively, but the solution the Redis community settled on is to run an SSL termination layer in front of Redis. On Enclave, we use stunnel, an industry standard. This means a good number of Redis clients just work and support it out of the box, including:
redis-rb (Ruby)
redis-py (Python)
Jedis (Java)
predis (PHP)
node_redis (Node.js)
StackExchange.Redis (.NET)
How do I use it?
For new Redis databases, select your Redis database in the Aptible Dashboard, and click “Reveal” under “Credentials” at the top. Aptible will provide two URLs:
redis:// protocol
rediss:// protocol (note the two “s”!)
Most Redis clients will automatically recognize a rediss:// URL and connect over SSL, but review your client’s documentation if you run into any trouble.
What about existing Redis databases?
For existing Redis databases, Aptible can enable SSL/TLS following a short downtime (about 30 seconds). If you’d like to do that, or have any feedback or questions, just let us know!
Jan 19, 2017
Jan 19, 2017
We’re proud to announce that as of today, new Redis databases provisioned on Aptible Enclave support SSL/TLS in addition to the regular Redis protocol. Because both AWS and Aptible require that you encrypt HIPAA Protected Health Information in transit, even within a private, dedicated Enclave stack, starting today you can now use Redis to store and process PHI on Enclave.
How does it work?
Redis doesn’t support SSL natively, but the solution the Redis community settled on is to run an SSL termination layer in front of Redis. On Enclave, we use stunnel, an industry standard. This means a good number of Redis clients just work and support it out of the box, including:
redis-rb (Ruby)
redis-py (Python)
Jedis (Java)
predis (PHP)
node_redis (Node.js)
StackExchange.Redis (.NET)
How do I use it?
For new Redis databases, select your Redis database in the Aptible Dashboard, and click “Reveal” under “Credentials” at the top. Aptible will provide two URLs:
redis:// protocol
rediss:// protocol (note the two “s”!)
Most Redis clients will automatically recognize a rediss:// URL and connect over SSL, but review your client’s documentation if you run into any trouble.
What about existing Redis databases?
For existing Redis databases, Aptible can enable SSL/TLS following a short downtime (about 30 seconds). If you’d like to do that, or have any feedback or questions, just let us know!
Jan 19, 2017
Jan 19, 2017
We’re happy to announce that the RabbitMQ management interface is now available for RabbitMQ databases deployed on Aptible Enclave. Until now, only the AMQP port was exposed, so you could push messages to queues, but managing queues was more difficult.
There’s a lot the RabbitMQ management interface can be used for, but for the most part it’s useful to review and manipulate the queues that exist in your RabbitMQ container.
How do I access it?
The RabbitMQ management interface is exposed by default on new RabbitMQ databases provisioned on Enclave. In the Aptible Dashboard, select your database, then select the “Credentials” link at the top. A modal will reveal all connection strings for that database, named by function:
For existing RabbitMQ databases, we can enable the management interface following a short downtime (about 30 seconds). If you’d like to do that, or have any feedback or questions, just let us know!
Jan 19, 2017
Jan 19, 2017
We’re happy to announce that the RabbitMQ management interface is now available for RabbitMQ databases deployed on Aptible Enclave. Until now, only the AMQP port was exposed, so you could push messages to queues, but managing queues was more difficult.
There’s a lot the RabbitMQ management interface can be used for, but for the most part it’s useful to review and manipulate the queues that exist in your RabbitMQ container.
How do I access it?
The RabbitMQ management interface is exposed by default on new RabbitMQ databases provisioned on Enclave. In the Aptible Dashboard, select your database, then select the “Credentials” link at the top. A modal will reveal all connection strings for that database, named by function:
For existing RabbitMQ databases, we can enable the management interface following a short downtime (about 30 seconds). If you’d like to do that, or have any feedback or questions, just let us know!
Jan 19, 2017
Jan 8, 2017
We’re proud to announce that the Aptible CLI is now supported on Windows!
More than a CLI: a Toolbelt!
We distribute the Aptible CLI as a package called the “Aptible Toolbelt.” The Toolbelt is available for several platforms, including macOS, Ubuntu, Debian, and CentOS. On Windows, it is available as an MSI installer.
On all platforms, the toolbelt includes:
The Aptible CLI itself, in the form of the aptible-cli Ruby gem; and
System dependencies the CLI needs to function properly. This includes Ruby (which the CLI is written in) and dependencies like OpenSSH (which the CLI uses for functionality like database tunnels).
The toolbelt integrates with your system to ensure that the aptible command lands on your PATH, so that when you type aptible in your command prompt, things just work. On Windows, this is done by modifying your PATH, and on OSX and Linux this is done by placing a symlink in /usr/local/bin.
Supported Platforms
The Windows package targets Windows 8.1 and up on the PC side, and Windows Server 2012r2 and up on the server side. In other words, it targets Windows NT 6.3 and up, which is why you’ll see that number in the installer name.
Download and Installation
To get the Aptible CLI on Windows, download it directly from the Aptible website, then run the installer.
You might receive a SmartScreen prompt indicating that the publisher (that’s us!) isn’t known. Because this is the first time we’ve shipped software for Windows, we don’t have a reputation with Microsoft yet. The installer is properly signed, so to proceed, click through “More Info” and verify that the reported publisher is Aptible, Inc.
Enjoy! Since this is still early days for the Windows version of the CLI, make sure to let us know if you hit any snags!
Jan 8, 2017
Jan 8, 2017
We’re proud to announce that the Aptible CLI is now supported on Windows!
More than a CLI: a Toolbelt!
We distribute the Aptible CLI as a package called the “Aptible Toolbelt.” The Toolbelt is available for several platforms, including macOS, Ubuntu, Debian, and CentOS. On Windows, it is available as an MSI installer.
On all platforms, the toolbelt includes:
The Aptible CLI itself, in the form of the aptible-cli Ruby gem; and
System dependencies the CLI needs to function properly. This includes Ruby (which the CLI is written in) and dependencies like OpenSSH (which the CLI uses for functionality like database tunnels).
The toolbelt integrates with your system to ensure that the aptible command lands on your PATH, so that when you type aptible in your command prompt, things just work. On Windows, this is done by modifying your PATH, and on OSX and Linux this is done by placing a symlink in /usr/local/bin.
Supported Platforms
The Windows package targets Windows 8.1 and up on the PC side, and Windows Server 2012r2 and up on the server side. In other words, it targets Windows NT 6.3 and up, which is why you’ll see that number in the installer name.
Download and Installation
To get the Aptible CLI on Windows, download it directly from the Aptible website, then run the installer.
You might receive a SmartScreen prompt indicating that the publisher (that’s us!) isn’t known. Because this is the first time we’ve shipped software for Windows, we don’t have a reputation with Microsoft yet. The installer is properly signed, so to proceed, click through “More Info” and verify that the reported publisher is Aptible, Inc.
Enjoy! Since this is still early days for the Windows version of the CLI, make sure to let us know if you hit any snags!
Jan 8, 2017
Dec 12, 2016
We’re happy to announce that as of this week, you can now cancel running deployments on Aptible Enclave!
When is cancelling a deployment useful?
1. Your app is failing the HTTP health check, and you know why
As described in this support article, Enclave performs an automatic health check on any app service with an endpoint attached to it. During this health check, the platform makes an HTTP request to the port exposed by your Docker container, and waits for an HTTP response (though not necessarily a successful HTTP status code).
When your app is failing the HTTP health check, Enclave waits for 10 minutes before giving up and cancelling the deployment.
But, if you know the health check is never going to succeed, that’s wasted time! In this case, just cancel the deployment, and the health check will stop immediately.
2. You need to stop your pre-release commands immediately
Running database migrations in a pre-release command is convenient, but it can sometimes backfire if you end up running a migration that’s unexpectedly expensive and impacts your live app.
In this case, you often want to just stop the pre-release command dead in its tracks. Cancelling the deployment will do that.
However, do note that Enclave cannot rollback whatever your pre-release command did before you cancelled it, so use this capability wisely!
How does it work?
When deploying an app on Enclave, you’ll be presented with an informational banner explaining how you might cancel that deployment if needed:
$ git push aptible master Counting objects: 15, done. Delta compression using up to 8 threads. Compressing objects: 100% (10/10), done. Writing objects: 100% (15/15), 1.20 KiB | 0 bytes/s, done. Total 15 (delta 5), reused 0 (delta 0) remote: (8ミ | INFO: Authorizing... remote: (8ミ | INFO: Initiating deploy... remote: (8ミ | INFO: Deploying 5e173381... remote: remote: (8ミ | INFO: Pressing CTRL + C now will NOT interrupt this deploy remote: (8ミ | INFO: (it will continue in the background) remote: remote: (8ミ | INFO: However, you can cancel this deploy using the Aptible CLI with: remote: (8ミ | INFO: aptible operation:cancel 15489 remote: (8ミ | INFO: (you might need to update your Aptible CLI)
At this point, running aptible operation:cancel .... in another terminal window will advise Enclave that you’d like to cancel this deployment.
Note that you’ll need version 0.8.0 of the Aptible CLI or greater to use this command. If you haven’t installed the CLI, or have an older version, then download the latest here. You can check your version from the CLI using aptible version.
Is it safe to cancel a deployment?
Yes! Under the hood, cancelling an Enclave operation initiates a rollback at the next safe point in your deployment. This ensures your app isn’t left in an inconsistent state when you cancel.
There are two considerations to keep in mind:
You cannot cancel a deployment between safe points. Notably, this means you can’t cancel the deployment during the Docker build step, which is still one big step with no safe points. (We would like to change this in the future.)
Cancelling your deployment may not take effect immediately, or at all. For example, if your deployment is already being rolled back, asking to cancel won’t do anything.
Enjoy!
Dec 12, 2016
Dec 12, 2016
We’re happy to announce that as of this week, you can now cancel running deployments on Aptible Enclave!
When is cancelling a deployment useful?
1. Your app is failing the HTTP health check, and you know why
As described in this support article, Enclave performs an automatic health check on any app service with an endpoint attached to it. During this health check, the platform makes an HTTP request to the port exposed by your Docker container, and waits for an HTTP response (though not necessarily a successful HTTP status code).
When your app is failing the HTTP health check, Enclave waits for 10 minutes before giving up and cancelling the deployment.
But, if you know the health check is never going to succeed, that’s wasted time! In this case, just cancel the deployment, and the health check will stop immediately.
2. You need to stop your pre-release commands immediately
Running database migrations in a pre-release command is convenient, but it can sometimes backfire if you end up running a migration that’s unexpectedly expensive and impacts your live app.
In this case, you often want to just stop the pre-release command dead in its tracks. Cancelling the deployment will do that.
However, do note that Enclave cannot rollback whatever your pre-release command did before you cancelled it, so use this capability wisely!
How does it work?
When deploying an app on Enclave, you’ll be presented with an informational banner explaining how you might cancel that deployment if needed:
$ git push aptible master Counting objects: 15, done. Delta compression using up to 8 threads. Compressing objects: 100% (10/10), done. Writing objects: 100% (15/15), 1.20 KiB | 0 bytes/s, done. Total 15 (delta 5), reused 0 (delta 0) remote: (8ミ | INFO: Authorizing... remote: (8ミ | INFO: Initiating deploy... remote: (8ミ | INFO: Deploying 5e173381... remote: remote: (8ミ | INFO: Pressing CTRL + C now will NOT interrupt this deploy remote: (8ミ | INFO: (it will continue in the background) remote: remote: (8ミ | INFO: However, you can cancel this deploy using the Aptible CLI with: remote: (8ミ | INFO: aptible operation:cancel 15489 remote: (8ミ | INFO: (you might need to update your Aptible CLI)
At this point, running aptible operation:cancel .... in another terminal window will advise Enclave that you’d like to cancel this deployment.
Note that you’ll need version 0.8.0 of the Aptible CLI or greater to use this command. If you haven’t installed the CLI, or have an older version, then download the latest here. You can check your version from the CLI using aptible version.
Is it safe to cancel a deployment?
Yes! Under the hood, cancelling an Enclave operation initiates a rollback at the next safe point in your deployment. This ensures your app isn’t left in an inconsistent state when you cancel.
There are two considerations to keep in mind:
You cannot cancel a deployment between safe points. Notably, this means you can’t cancel the deployment during the Docker build step, which is still one big step with no safe points. (We would like to change this in the future.)
Cancelling your deployment may not take effect immediately, or at all. For example, if your deployment is already being rolled back, asking to cancel won’t do anything.
Enjoy!
Dec 12, 2016
Nov 29, 2016
We’re proud to announce that as of this week, you can now route database logs to a Log Drain, just like you’d do with app logs! This option is available when you create a new Log Drain; you can opt to send either app or database logs, or both:
If you already have a Log Drain set up for apps (you should!), you can opt to either recreate it to capture both app and database logs, or simply create a new one that only captures database logs.
Why Capture Database Logs?
Aptible customers have asked for database logs for two main use cases: compliance and operations.
From a compliance perspective, you can use database logs to facilitate audit logging, for example by logging sensitive queries made to your database (or all queries for that matter, if that’s a realistic option for you).
From an operations standpoint, you can use them to identify new performance problems (e.g. by logging slow queries made to your database), or to better understand problems you’ve already identified (e.g. by correlating database log entries with issues you’ve experienced).
What Does My Database Log?
Your database may not log what you care about out of the box. For example, Postgres is pretty quiet by default. You can usually modify logging parameters by connecting to your database and issuing re-configuration statements.
For example, to enable slow query logging in Postgres >= 9.4, you’d create a database tunnel and run the following commands:
ALTER SYSTEM SET log_min_duration_statement = 200; ALTER SYSTEM SET log_min_messages = 'INFO'; SELECT pg_reload_conf();
Refer to your database’s documentation for more information, or contact support and we’ll be happy to help.
How Do I Differentiate Database Logs From App Logs?
For Elasticsearch and HTTPS Log Drains, log entries sent to your Log Drain now include a “layer” field that indicates whether the log came from an app or a database.
Here’s an example comparing app and database logs using Kibana. Most of the logs here came from the app (respectively from a web and a background service), but we also have a slow query logged by Postgres:
For Syslog Log Drains, the database handle and type is included as the source program (that’s the service field you can see reported in Kibana above).
CLI Support, and Aptible Legacy Infrastructure.
At this time, database logs are not available via the CLI, and are not available on Aptible legacy infrastructure. We’re working on adding support in the CLI, so this will be available very soon!
Update: aptible logs now supports databases! Download the latest CLI and use aptible logs --database HANDLE.
If you are still running on Aptible legacy infrastructure (as indicated in the Aptible Dashboard when you provision a Log Drain), we encourage you to contact Aptible Support to coordinate a migration. This will give you access to database logs, as well as a growing number of other new features (such as ALB Endpoints, support for deploying directly from a Docker image and on-demand database restores).
Enjoy!
Nov 29, 2016
Nov 29, 2016
We’re proud to announce that as of this week, you can now route database logs to a Log Drain, just like you’d do with app logs! This option is available when you create a new Log Drain; you can opt to send either app or database logs, or both:
If you already have a Log Drain set up for apps (you should!), you can opt to either recreate it to capture both app and database logs, or simply create a new one that only captures database logs.
Why Capture Database Logs?
Aptible customers have asked for database logs for two main use cases: compliance and operations.
From a compliance perspective, you can use database logs to facilitate audit logging, for example by logging sensitive queries made to your database (or all queries for that matter, if that’s a realistic option for you).
From an operations standpoint, you can use them to identify new performance problems (e.g. by logging slow queries made to your database), or to better understand problems you’ve already identified (e.g. by correlating database log entries with issues you’ve experienced).
What Does My Database Log?
Your database may not log what you care about out of the box. For example, Postgres is pretty quiet by default. You can usually modify logging parameters by connecting to your database and issuing re-configuration statements.
For example, to enable slow query logging in Postgres >= 9.4, you’d create a database tunnel and run the following commands:
ALTER SYSTEM SET log_min_duration_statement = 200; ALTER SYSTEM SET log_min_messages = 'INFO'; SELECT pg_reload_conf();
Refer to your database’s documentation for more information, or contact support and we’ll be happy to help.
How Do I Differentiate Database Logs From App Logs?
For Elasticsearch and HTTPS Log Drains, log entries sent to your Log Drain now include a “layer” field that indicates whether the log came from an app or a database.
Here’s an example comparing app and database logs using Kibana. Most of the logs here came from the app (respectively from a web and a background service), but we also have a slow query logged by Postgres:
For Syslog Log Drains, the database handle and type is included as the source program (that’s the service field you can see reported in Kibana above).
CLI Support, and Aptible Legacy Infrastructure.
At this time, database logs are not available via the CLI, and are not available on Aptible legacy infrastructure. We’re working on adding support in the CLI, so this will be available very soon!
Update: aptible logs now supports databases! Download the latest CLI and use aptible logs --database HANDLE.
If you are still running on Aptible legacy infrastructure (as indicated in the Aptible Dashboard when you provision a Log Drain), we encourage you to contact Aptible Support to coordinate a migration. This will give you access to database logs, as well as a growing number of other new features (such as ALB Endpoints, support for deploying directly from a Docker image and on-demand database restores).
Enjoy!
Nov 29, 2016
Aug 4, 2016
Earlier this week, we released Managed HTTPS Endpoints. These endpoints have a few key benefits:
Your SSL/TLS certificate is free (!)
Aptible handles generating the initial certificate
Aptible handles renewing the certificate
All you need to get started with a Managed HTTPS Endpoint is a domain name! No more ops headaches trying to generate CSRs, keep private keys and certs straight, or deal with inconveniently-timed renewals.
Under the hood, Managed HTTPS uses Let’s Encrypt to automatically provision certificates for you. Aptible customers requested this feature, and we are proud to contribute to the global movement towards 100% HTTPS.
How it works
Setting up a Managed HTTPS Endpoint is a 3-step process:
Add an Endpoint to your app, and choose Managed HTTPS as the endpoint type. You will need to provide the domain name you intend to use with your app (e.g. www.myapp.com). Aptible will use that name to provision a certificate via Let’s Encrypt.
When you create the endpoint, Aptible will provide you with an endpoint address. Use your DNS provider to create a CNAME from your domain (www.myapp.com) to this endpoint address (something like elb-1234.aptible.in).
Back in the Aptible Dashboard, confirm that you created the CNAME. Aptible will automatically provision your certificate, and you’re in business!
Note that between steps 2 and 3, your app won’t be available because you need to set up the CNAME before Aptible can provision the certificate. This isn’t ideal if you are migrating an app from somewhere else. Fortunately, you can just provide a transitional certificate that Aptible will use until your new Let’s Encrypt certificate is available. If you need to add a new certificate for this, just select the “Certificates” tab under your main environment view.
Once your endpoint is up and running done, we recommend you review our instructions for customizing SSL, in order to redirect end-users to HTTPS and disable the use of weaker cipher suites, which will earn the much-coveted A+ grade on Qualys’ SSL Test!
Why use Managed HTTPS?
Above all else, Managed HTTPS brings you simplicity and peace of mind:
Setup is greatly simplified: all you need is a domain name. No need to generate your own certificate signing request, deal with a CA, or upload your certificate and key to Aptible.
Maintenance is essentially eliminated: you won’t need to remember to renew a certificate ever again.
Oh, and did we mention it’s free?
Enjoy! As usual, let us know if you have any feedback.
Aug 4, 2016
Aug 4, 2016
Earlier this week, we released Managed HTTPS Endpoints. These endpoints have a few key benefits:
Your SSL/TLS certificate is free (!)
Aptible handles generating the initial certificate
Aptible handles renewing the certificate
All you need to get started with a Managed HTTPS Endpoint is a domain name! No more ops headaches trying to generate CSRs, keep private keys and certs straight, or deal with inconveniently-timed renewals.
Under the hood, Managed HTTPS uses Let’s Encrypt to automatically provision certificates for you. Aptible customers requested this feature, and we are proud to contribute to the global movement towards 100% HTTPS.
How it works
Setting up a Managed HTTPS Endpoint is a 3-step process:
Add an Endpoint to your app, and choose Managed HTTPS as the endpoint type. You will need to provide the domain name you intend to use with your app (e.g. www.myapp.com). Aptible will use that name to provision a certificate via Let’s Encrypt.
When you create the endpoint, Aptible will provide you with an endpoint address. Use your DNS provider to create a CNAME from your domain (www.myapp.com) to this endpoint address (something like elb-1234.aptible.in).
Back in the Aptible Dashboard, confirm that you created the CNAME. Aptible will automatically provision your certificate, and you’re in business!
Note that between steps 2 and 3, your app won’t be available because you need to set up the CNAME before Aptible can provision the certificate. This isn’t ideal if you are migrating an app from somewhere else. Fortunately, you can just provide a transitional certificate that Aptible will use until your new Let’s Encrypt certificate is available. If you need to add a new certificate for this, just select the “Certificates” tab under your main environment view.
Once your endpoint is up and running done, we recommend you review our instructions for customizing SSL, in order to redirect end-users to HTTPS and disable the use of weaker cipher suites, which will earn the much-coveted A+ grade on Qualys’ SSL Test!
Why use Managed HTTPS?
Above all else, Managed HTTPS brings you simplicity and peace of mind:
Setup is greatly simplified: all you need is a domain name. No need to generate your own certificate signing request, deal with a CA, or upload your certificate and key to Aptible.
Maintenance is essentially eliminated: you won’t need to remember to renew a certificate ever again.
Oh, and did we mention it’s free?
Enjoy! As usual, let us know if you have any feedback.
Aug 4, 2016
Jul 31, 2016
Aptible customers have always been able to streamline deployment by building from base images hosted in public Docker registries. For example, the Aptible Ruby on Rails Quickstart uses FROM quay.io/aptible/ruby:2.3, eliminating the need to install Ruby during each Aptible build.
Many customers would like to do even more work outside their Aptible build, including prebuilding code that should be kept private. In those cases, pulling a base image from a public Docker registry is not feasible, so today we are happy to announce that you can now deploy Aptible apps from private images hosted on Docker Hub, Quay.io, and other private registries! This feature is supported for all v2 stacks.
How does it work?
To start from scratch, first create an app on Aptible. You will still need to use git, since we will still push a repo with a single Procfile file, used to define the app’s services and their commands. If your entire app is prebuilt in the image, you do not need a Dockerfile.
Next, use the Aptible CLI’s aptible config:set command to set a few environment variables:
The name of the image to pull, in the format registry_host/repo/image_name:tag. Repo and image name are required. Tag is optional and will default to latest. If you are not using Docker Hub (if for example you’re using ) then the registry host name is also required.
The private registry host to pull from. Required when pulling from a private registry. Defaults to docker.io
The username to use when pulling the image. Required when pulling from a private registry.
The password of the registry to pull from. Required when pulling from a private registry.
The e-mail to use when pulling. Optional. Defaults to .
Note that you can omit a Dockerfile and only set APTIBLE_DOCKER_IMAGE to initiate a deploy from a public Docker registry image.
Example
To illustrate the steps above, assume we have a basic Ruby on Rails app image prebuilt and hosted in a private registry:
$ mkdir example-docker-app $ cd example-docker-app && git init . $ aptible apps:create example-docker-app --environment my-env > App example-docker-app created! > Git remote: git@beta.aptible.com:my-env/example-docker-app.git $ aptible config:set APTIBLE_PRIVATE_REGISTRY_HOST=[registry host] APTIBLE_DOCKER_IMAGE=[image name] APTIBLE_PRIVATE_REGISTRY_USERNAME=[username] APTIBLE_PRIVATE_REGISTRY_PASSWORD=[password] $ echo "web: bundle exec rails s" > Procfile $ git add Procfile && commit -m "test docker pull" $ git remote add aptible git@beta.aptible.com:my-env/example-docker-app.git $ git push aptible master
In this example, because you set APTIBLE_DOCKER_IMAGE, when you git push the platform will pull and run the image specified using the provided credentials.
Note that if a Dockerfile is present, APTIBLE_DOCKER_IMAGE will override the Dockerfile and the Dockerfile will be ignored.
Extending a Private Image
You may want to still build an app from scratch upon deploy, but would like to standardize or harden a private base image. In this case, your Aptible app will still need a Dockerfile commited to version control, but the Dockerfile’s FROM directive can reference a private image. Be sure to specify your registry credentials with the variables above, but be sure to omit APTIBLE_DOCKER_IMAGE(since otherwise the Dockerfile will be ignored).
As usual, we would love to hear your feedback! If you have any questions or comments, please let us know!
Jul 31, 2016
Jul 31, 2016
Aptible customers have always been able to streamline deployment by building from base images hosted in public Docker registries. For example, the Aptible Ruby on Rails Quickstart uses FROM quay.io/aptible/ruby:2.3, eliminating the need to install Ruby during each Aptible build.
Many customers would like to do even more work outside their Aptible build, including prebuilding code that should be kept private. In those cases, pulling a base image from a public Docker registry is not feasible, so today we are happy to announce that you can now deploy Aptible apps from private images hosted on Docker Hub, Quay.io, and other private registries! This feature is supported for all v2 stacks.
How does it work?
To start from scratch, first create an app on Aptible. You will still need to use git, since we will still push a repo with a single Procfile file, used to define the app’s services and their commands. If your entire app is prebuilt in the image, you do not need a Dockerfile.
Next, use the Aptible CLI’s aptible config:set command to set a few environment variables:
The name of the image to pull, in the format registry_host/repo/image_name:tag. Repo and image name are required. Tag is optional and will default to latest. If you are not using Docker Hub (if for example you’re using ) then the registry host name is also required.
The private registry host to pull from. Required when pulling from a private registry. Defaults to docker.io
The username to use when pulling the image. Required when pulling from a private registry.
The password of the registry to pull from. Required when pulling from a private registry.
The e-mail to use when pulling. Optional. Defaults to .
Note that you can omit a Dockerfile and only set APTIBLE_DOCKER_IMAGE to initiate a deploy from a public Docker registry image.
Example
To illustrate the steps above, assume we have a basic Ruby on Rails app image prebuilt and hosted in a private registry:
$ mkdir example-docker-app $ cd example-docker-app && git init . $ aptible apps:create example-docker-app --environment my-env > App example-docker-app created! > Git remote: git@beta.aptible.com:my-env/example-docker-app.git $ aptible config:set APTIBLE_PRIVATE_REGISTRY_HOST=[registry host] APTIBLE_DOCKER_IMAGE=[image name] APTIBLE_PRIVATE_REGISTRY_USERNAME=[username] APTIBLE_PRIVATE_REGISTRY_PASSWORD=[password] $ echo "web: bundle exec rails s" > Procfile $ git add Procfile && commit -m "test docker pull" $ git remote add aptible git@beta.aptible.com:my-env/example-docker-app.git $ git push aptible master
In this example, because you set APTIBLE_DOCKER_IMAGE, when you git push the platform will pull and run the image specified using the provided credentials.
Note that if a Dockerfile is present, APTIBLE_DOCKER_IMAGE will override the Dockerfile and the Dockerfile will be ignored.
Extending a Private Image
You may want to still build an app from scratch upon deploy, but would like to standardize or harden a private base image. In this case, your Aptible app will still need a Dockerfile commited to version control, but the Dockerfile’s FROM directive can reference a private image. Be sure to specify your registry credentials with the variables above, but be sure to omit APTIBLE_DOCKER_IMAGE(since otherwise the Dockerfile will be ignored).
As usual, we would love to hear your feedback! If you have any questions or comments, please let us know!
Jul 31, 2016
Jun 21, 2016
Contingency planning and disaster recovery are critical parts of any developer’s HIPAA compliance program. The Aptible platform automates many aspects of secure data management, including long-term retention, encryption at rest, taking automatic daily backups of your databases, and distributing those backups across geographically separate regions. These benefits require no setup and no maintenance on your part: Aptible simply takes care of them.
That said, recovering a database from a backup has required a support request. While we take pride in providing timely and effective support, it’s nice to be able to do things at your own pace, without the need to wait on someone else.
That’s why we’re proud to announce that for all v2 stacks, you can view and restore backups directly in the Aptible dashboard and CLI! (For customers on v1 stacks, you can view, but not self-restore.)
How does it work?
In the dashboard, locate any database, then select the “Backups” tab. Find the backup you would like to restore from, and select the “Restore” action. From the CLI, first update to the newest version (gem update aptible-cli), then run aptible backup:list $HANDLE to view backups for a database, or aptible backup:restore $ID to restore a backup.
Restoring from a backup creates a new database - it never replaces or overwrites your existing database. You can use this feature to test your disaster recovery plans, test or review new database migrations before you run them against production, roll back to a prior backup, or simply review old data. When you are done using the restored database, you can deprovision it or promote it to be used by your apps.
But wait, there’s more!
Introducing On-Demand Backups
In addition to displaying automatic daily backups, you can now trigger a new backup on demand from the dashboard or CLI. In the dashboard, simply select the large green “Create New Backup” button. From the CLI, make sure you are running the latest version (gem update aptible-cli) then use aptible db:backup $HANDLE to trigger a new backup.
Now, before you do something scary with your database (like a big migration), you have an extra safety net. On-demand backups are easier than filing a support request and safer than using a tunnel to dump to a local environment, because you will never have to remember to purge data from your machine.
We hope you find both of these features useful! That’s it for today. As usual, if you have questions or feedback about this feature, just get in touch.
Jun 21, 2016
Jun 21, 2016
Contingency planning and disaster recovery are critical parts of any developer’s HIPAA compliance program. The Aptible platform automates many aspects of secure data management, including long-term retention, encryption at rest, taking automatic daily backups of your databases, and distributing those backups across geographically separate regions. These benefits require no setup and no maintenance on your part: Aptible simply takes care of them.
That said, recovering a database from a backup has required a support request. While we take pride in providing timely and effective support, it’s nice to be able to do things at your own pace, without the need to wait on someone else.
That’s why we’re proud to announce that for all v2 stacks, you can view and restore backups directly in the Aptible dashboard and CLI! (For customers on v1 stacks, you can view, but not self-restore.)
How does it work?
In the dashboard, locate any database, then select the “Backups” tab. Find the backup you would like to restore from, and select the “Restore” action. From the CLI, first update to the newest version (gem update aptible-cli), then run aptible backup:list $HANDLE to view backups for a database, or aptible backup:restore $ID to restore a backup.
Restoring from a backup creates a new database - it never replaces or overwrites your existing database. You can use this feature to test your disaster recovery plans, test or review new database migrations before you run them against production, roll back to a prior backup, or simply review old data. When you are done using the restored database, you can deprovision it or promote it to be used by your apps.
But wait, there’s more!
Introducing On-Demand Backups
In addition to displaying automatic daily backups, you can now trigger a new backup on demand from the dashboard or CLI. In the dashboard, simply select the large green “Create New Backup” button. From the CLI, make sure you are running the latest version (gem update aptible-cli) then use aptible db:backup $HANDLE to trigger a new backup.
Now, before you do something scary with your database (like a big migration), you have an extra safety net. On-demand backups are easier than filing a support request and safer than using a tunnel to dump to a local environment, because you will never have to remember to purge data from your machine.
We hope you find both of these features useful! That’s it for today. As usual, if you have questions or feedback about this feature, just get in touch.
Jun 21, 2016
May 19, 2016
We’re happy to announce that two-factor authentication (2FA) is available for all users and account types in the Aptible dashboard and CLI! Multifactor authentication is a best practice that adds an additional layer of security on top of the normal username and password you use to verify your identity. You can enable it in your Aptible user settings.
How does it work?
Aptible 2-factor authentication implements the Time-based One-time Password (TOTP) algorithm specified in RFC 6238. We currently support the virtual token form factor - Google Authenticator is an excellent, free app you can use. We do not currently support SMS or hardware tokens.
When enabled, 2FA protects access to your Aptible account via the dashboard, CLI, and API. 2FA does not restrict Git pushes - these are still authenticated by your SSH key. In some cases, you may not push code with your own user credentials, for example if you deploy with a CI service such as Travis or Circle and perform all deploys via a robot user. If so, we encourage you to remove SSH keys from your Aptible user account.
What if I’m locked out?
When you enable 2FA, you get emergency backup codes, in case your device is lost, stolen, or temporarily unavailable. Keep these in a safe place. If you don’t have your device and are unable to access a backup code, please contact us.
As usual, we’d love to hear your feedback! If you have any questions or comments, please let us know!
May 19, 2016
May 19, 2016
We’re happy to announce that two-factor authentication (2FA) is available for all users and account types in the Aptible dashboard and CLI! Multifactor authentication is a best practice that adds an additional layer of security on top of the normal username and password you use to verify your identity. You can enable it in your Aptible user settings.
How does it work?
Aptible 2-factor authentication implements the Time-based One-time Password (TOTP) algorithm specified in RFC 6238. We currently support the virtual token form factor - Google Authenticator is an excellent, free app you can use. We do not currently support SMS or hardware tokens.
When enabled, 2FA protects access to your Aptible account via the dashboard, CLI, and API. 2FA does not restrict Git pushes - these are still authenticated by your SSH key. In some cases, you may not push code with your own user credentials, for example if you deploy with a CI service such as Travis or Circle and perform all deploys via a robot user. If so, we encourage you to remove SSH keys from your Aptible user account.
What if I’m locked out?
When you enable 2FA, you get emergency backup codes, in case your device is lost, stolen, or temporarily unavailable. Keep these in a safe place. If you don’t have your device and are unable to access a backup code, please contact us.
As usual, we’d love to hear your feedback! If you have any questions or comments, please let us know!
May 19, 2016
May 16, 2016
If you are on an Aptible “v2” stack, which automatically scales your app containers across AWS Availability Zones, you have probably noticed that the aptible logs CLI command has been deprecated. As an alternative, you’ve been able to use Log Drains to collect app logs.
A Log Drain’s ability to persist logs (not just stream them) makes it a robust option, however each drain requires some setup. aptible logs is built in to the Aptible CLI, requires no additional setup, and makes it easy to see what is happening in your app right now.
We’re happy to announce that aptible logs is available on Aptible v2 stacks!
How Can I Use It?
If you already have the Aptible CLI installed, then you don’t need to do anything: using aptible logs from the CLI works on all stacks as of today. There is a deprecation notice for aptible logs in older versions of the CLI - you can make it go away by updating the CLI.
If you don’t have the CLI installed, follow the installation instructions first.
Technical Details
Aptible logs on v2 stacks is implemented as a Log Drain that doesn’t drain: instead, it buffers logs received from log forwarders and allows clients to stream the buffer.
As a result, the first time you use aptible logs on a v2 stack, we’ll take a few minutes to automatically provision a special new “tail” Log Drain, if you don’t already have one. Once you have a tail Log Drain, subsequent aptible logs calls are fast.
If you have any questions or feedback about this new feature, please let us know!
May 16, 2016
May 16, 2016
If you are on an Aptible “v2” stack, which automatically scales your app containers across AWS Availability Zones, you have probably noticed that the aptible logs CLI command has been deprecated. As an alternative, you’ve been able to use Log Drains to collect app logs.
A Log Drain’s ability to persist logs (not just stream them) makes it a robust option, however each drain requires some setup. aptible logs is built in to the Aptible CLI, requires no additional setup, and makes it easy to see what is happening in your app right now.
We’re happy to announce that aptible logs is available on Aptible v2 stacks!
How Can I Use It?
If you already have the Aptible CLI installed, then you don’t need to do anything: using aptible logs from the CLI works on all stacks as of today. There is a deprecation notice for aptible logs in older versions of the CLI - you can make it go away by updating the CLI.
If you don’t have the CLI installed, follow the installation instructions first.
Technical Details
Aptible logs on v2 stacks is implemented as a Log Drain that doesn’t drain: instead, it buffers logs received from log forwarders and allows clients to stream the buffer.
As a result, the first time you use aptible logs on a v2 stack, we’ll take a few minutes to automatically provision a special new “tail” Log Drain, if you don’t already have one. Once you have a tail Log Drain, subsequent aptible logs calls are fast.
If you have any questions or feedback about this new feature, please let us know!
May 16, 2016
Apr 7, 2016
Aptible customers have been asking how they could view performance metrics such as RAM and CPU usage for their containers. We’re happy to announce that the wait is coming to an end!
Last week, we started rolling out the first iteration of our new Container Metrics feature. You can access them via the “View Metrics” buttons on an App’s service list, or the “Metrics” tab for a Database. As an Aptible user, this lets you visualize performance metrics for your app and database containers directly from your dashboard. In turn, you can use this information to identify performance bottlenecks and make informed scaling decisions.
Metrics are available for apps and databases. In both cases, you can visualize:
Memory usage, including a breakdown in terms of RSS vs. caches / buffers. We’ll soon be including your memory limits in the graph as well, so you can compare your actual usage to your memory allocation.
Load average, which reflects the overall activity of your container in terms of CPU and I/O.
Both of these metrics are “bog-standard” Linux metrics, meaning there is a ton of information about them on the Internet. That being said, you can also hover over the little “?” icon in the UI for a quick reminder:
Using Container Metrics to Debug Performance
Let’s work through an example of how you can use these charts to understand performance issues and make scaling decisions. In this example, we’re running pgbench against a Postgres database (initially provisioned on a 1GB container), and we’ll explore easy ways to get better performance out of it.
First, take a look at the graphs:
It looks like database traffic surged at 6:24 PM UTC, lasting until 6:44 PM UTC. That’s our pgbench run.
Our container quickly consumed 100% of its 1 GB of available memory. Most of the memory was allocated for kernel page caches, which Linux uses to minimize expensive I/O requests.
With a load average consistently over 20 (i.e. > 20 tasks blocked waiting on CPU or I/O), our database operations are going to be very delayed. If our app was experiencing slowdowns around the same time, our database would be a likely suspect.
Armed with that knowledge, what can we do? A high load average can be caused by a bottleneck in terms of I/O or CPU, or both. Detailed CPU and I/O metrics are coming soon. In the meantime, upgrading to a bigger container might help with both our problems:
Our CPU allocation would be bigger, which essentially means we’d run CPU tasks faster.
Our memory allocation would be bigger, which means more memory for caches and buffers, which means faster disk reads (disk writes on the other hand would probably not be faster, since it’s important that they actually hit the disk for durability, rather than sit in a buffer).
Using Container Metrics to Evaluate Scaling
After upgrading our container, let’s run the benchmark again:
Clearly, the kernel is making good use of that extra memory we allocated for the container!
This time around, the benchmark completed faster, finishing in 12 minutes instead of 20, and with a load average that hung around 10, not 20. If we had an app connecting to our database and running actual queries, we’d be experiencing shorter delays when hitting the database.
Now, there’s still room for improvement. In a real-world scenario, you’d have several options to explore next:
Throw even more resources at the problem, e.g., an 8GB container, or bigger. Perhaps more unexpectedly, using a larger database volume would probably help as well: Aptible stores data on AWS EBS volumes, and larger EBS volumes are allocated more I/O bandwidth.
Optimize the queries you’re making against your database. Using an APM tool like New Relic can help you find which ones are draining your performance the most.
Investigate database-level parameter tuning (e.g. work_mem on Postgres).
I hope this example gives you an idea of how you can use Container Metrics to keep tabs on your application and database performance, and make informed scaling decisions. If you have any feedback or questions regarding this new feature, please do get in touch with Aptible support!
Apr 7, 2016
Apr 7, 2016
Aptible customers have been asking how they could view performance metrics such as RAM and CPU usage for their containers. We’re happy to announce that the wait is coming to an end!
Last week, we started rolling out the first iteration of our new Container Metrics feature. You can access them via the “View Metrics” buttons on an App’s service list, or the “Metrics” tab for a Database. As an Aptible user, this lets you visualize performance metrics for your app and database containers directly from your dashboard. In turn, you can use this information to identify performance bottlenecks and make informed scaling decisions.
Metrics are available for apps and databases. In both cases, you can visualize:
Memory usage, including a breakdown in terms of RSS vs. caches / buffers. We’ll soon be including your memory limits in the graph as well, so you can compare your actual usage to your memory allocation.
Load average, which reflects the overall activity of your container in terms of CPU and I/O.
Both of these metrics are “bog-standard” Linux metrics, meaning there is a ton of information about them on the Internet. That being said, you can also hover over the little “?” icon in the UI for a quick reminder:
Using Container Metrics to Debug Performance
Let’s work through an example of how you can use these charts to understand performance issues and make scaling decisions. In this example, we’re running pgbench against a Postgres database (initially provisioned on a 1GB container), and we’ll explore easy ways to get better performance out of it.
First, take a look at the graphs:
It looks like database traffic surged at 6:24 PM UTC, lasting until 6:44 PM UTC. That’s our pgbench run.
Our container quickly consumed 100% of its 1 GB of available memory. Most of the memory was allocated for kernel page caches, which Linux uses to minimize expensive I/O requests.
With a load average consistently over 20 (i.e. > 20 tasks blocked waiting on CPU or I/O), our database operations are going to be very delayed. If our app was experiencing slowdowns around the same time, our database would be a likely suspect.
Armed with that knowledge, what can we do? A high load average can be caused by a bottleneck in terms of I/O or CPU, or both. Detailed CPU and I/O metrics are coming soon. In the meantime, upgrading to a bigger container might help with both our problems:
Our CPU allocation would be bigger, which essentially means we’d run CPU tasks faster.
Our memory allocation would be bigger, which means more memory for caches and buffers, which means faster disk reads (disk writes on the other hand would probably not be faster, since it’s important that they actually hit the disk for durability, rather than sit in a buffer).
Using Container Metrics to Evaluate Scaling
After upgrading our container, let’s run the benchmark again:
Clearly, the kernel is making good use of that extra memory we allocated for the container!
This time around, the benchmark completed faster, finishing in 12 minutes instead of 20, and with a load average that hung around 10, not 20. If we had an app connecting to our database and running actual queries, we’d be experiencing shorter delays when hitting the database.
Now, there’s still room for improvement. In a real-world scenario, you’d have several options to explore next:
Throw even more resources at the problem, e.g., an 8GB container, or bigger. Perhaps more unexpectedly, using a larger database volume would probably help as well: Aptible stores data on AWS EBS volumes, and larger EBS volumes are allocated more I/O bandwidth.
Optimize the queries you’re making against your database. Using an APM tool like New Relic can help you find which ones are draining your performance the most.
Investigate database-level parameter tuning (e.g. work_mem on Postgres).
I hope this example gives you an idea of how you can use Container Metrics to keep tabs on your application and database performance, and make informed scaling decisions. If you have any feedback or questions regarding this new feature, please do get in touch with Aptible support!
Apr 7, 2016
548 Market St #75826 San Francisco, CA 94104
© 2025. All rights reserved. Privacy Policy
548 Market St #75826 San Francisco, CA 94104
© 2025. All rights reserved. Privacy Policy
548 Market St #75826 San Francisco, CA 94104
© 2025. All rights reserved. Privacy Policy
548 Market St #75826 San Francisco, CA 94104
© 2025. All rights reserved. Privacy Policy