- Aptible-hosted: This method allows you to route metrics to an InfluxDB Database hosted on Aptible. This Database must live in the same Environment as the Metrics you are retrieving. Additionally, the Aptible Metrics Terraform Module uses this method to deploy prebuilt Grafana dashboards with alerts for monitoring RAM & CPU usage for your Apps & Databases - so you can instantly start monitoring your Aptible resources.
- Hosted anywhere: This method allows you to route Metrics to any InfluxDB. This might be useful if you are leveraging InfluxData’s hosted InfluxDB offering.
InfluxDB Metrics Structure
Aptible InfluxDB Metric Drains publish metrics in a series namedmetrics.
The following values are published (approximately every 30 seconds):
running: a boolean indicating whether the Container was running when this point was sampled.milli_cpu_usage: the Container’s average CPU usage (in milli CPUs) over the reporting period.milli_cpu_limit: the maximum CPU accessible to the container.memory_total_mb: the Container’s total memory usage.memory_rss_mb: the Container’s RSS memory usage. This memory is typically not reclaimable. If this exceeds thememory_limit_mb, the container will be restarted.memory_limit_mb: the Container’s Memory Limit.disk_read_kbps: the Container’s average disk read bandwidth over the reporting period.disk_write_kbps: the Container’s average disk write bandwidth over the reporting period.disk_read_iops: the Container’s average disk read IOPS over the reporting period.disk_write_iops: the Container’s average disk write IOPS over the reporting period.disk_usage_mb: the Database’s Disk usage (Database metrics only).disk_limit_mb: the Database’s Disk size (Database metrics only).pids_current: the current number of tasks in the Container (see Other Limits).pids_limit: the maximum number of tasks for the Container (see Other Limits).
📘 Review Understanding Memory Utilization for more information on the meaning of thememory_total_mbandmemory_rss_mbvalues.
📘 Review I/O Performance for more information on the meaning of theAll points are enriched with the following tags:disk_read_iopsanddisk_write_iopsvalues.
environment: Environment handleapp: App handle (App metrics only)database: Database handle (Database metrics only)service: Service namehost_name: Container Hostname (Short Container ID)container: full Container ID
Getting Started
Creating a Influx Metric Drain
Creating a Influx Metric Drain
You can set up an InfluxDB Metric Drain in the following ways:
- (Aptible-hosted only) Using Aptible Metrics Terraform Module. This provision an Influx Metric Drain with pre-built Grafana dashboards and alerts for monitoring RAM & CPU usage for your Apps & Databases. This simplifies the setup of Metric Drains so you can start monitoring your Aptible resources immediately, all hosted within your Aptible account.
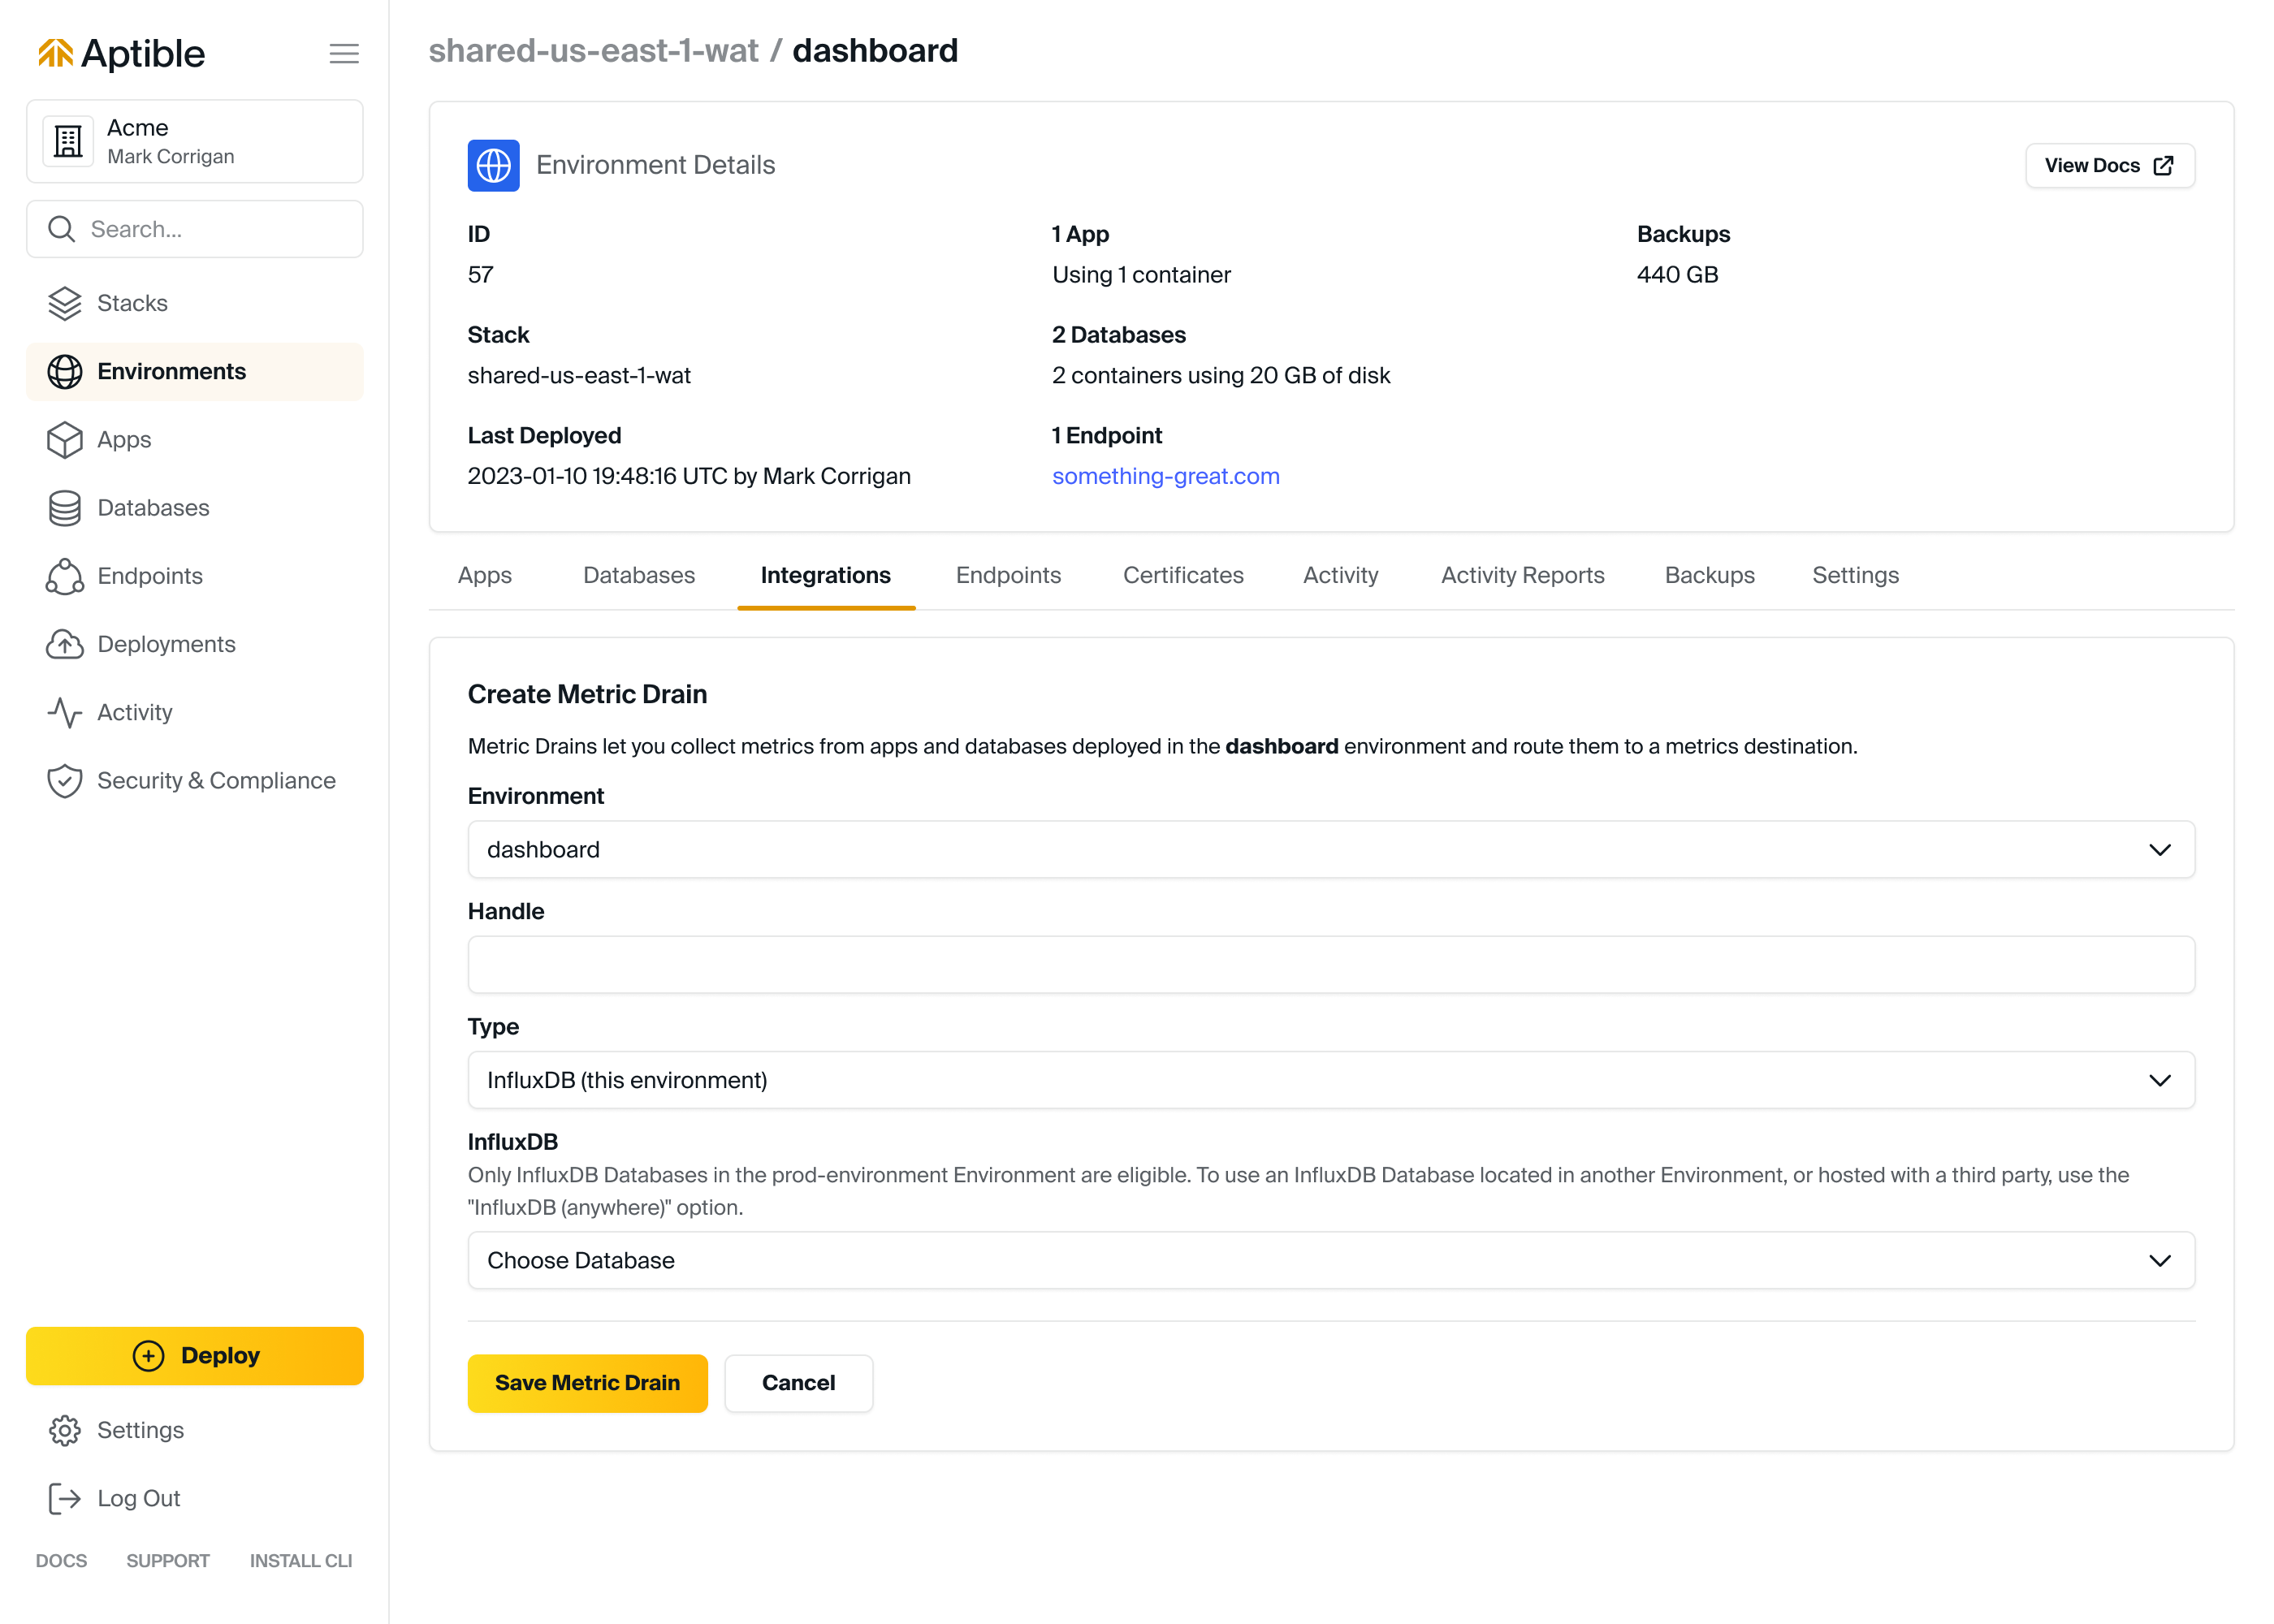
- Within the Aptible Dashboard by navigating to the respective Environment > selecting the “Metrics Drain” tab > selecting “Create Metric Drain” > selecting “InfluxDB (This Environment)” or “InfluxDB (Anywhere)”
- Using the
aptible metric_drain:create:influxdbcommand
Accessing Metrics in DB
Accessing Metrics in DB
The best approach to accessing metrics from InfluxDB is to deploy Grafana. Grafana is easy to deploy on Aptible.
- Recommended: Using Aptible Metrics Terraform Module. This provisions Metric Drains with pre-built Grafana dashboards and alerts for monitoring RAM & CPU usage for your Apps & Databases. This simplifies the setup of Metric Drains so you can start monitoring your Aptible resources immediately, all hosted within your Aptible account.
- You can also follow this tutorial Deploying Grafana on Aptible, which includes suggested queries to set up within Grafana.