Overview
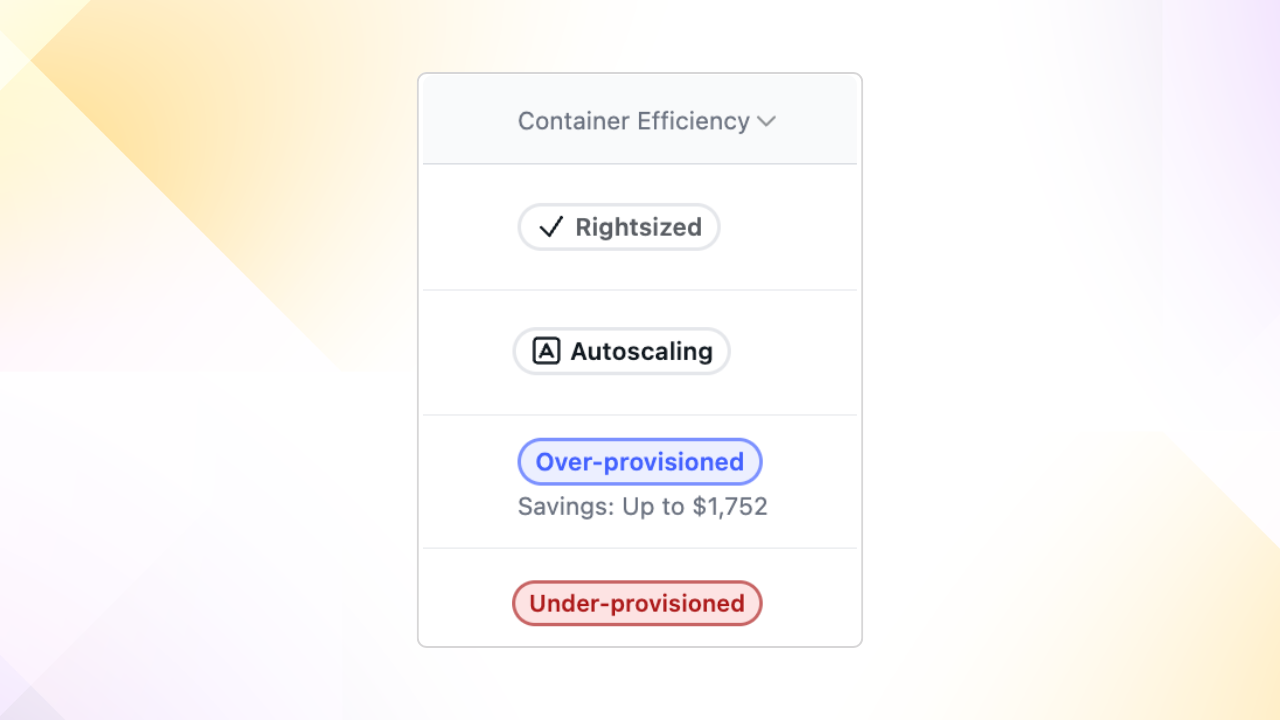
Container Efficiency recommendations appear in the Aptible Dashboard for App Services and Databases. You’ll find the Container Efficiency column in the App Services and Database list views, with detailed recommendations on each resource’s Scale page under Insights and Recommendations. Each resource displays one of the following statuses:- Rightsized - Your container is optimally sized for performance and cost efficiency
- Under-provisioned - Increase resources to meet demand and improve reliability
- Over-provisioned - Reduce resources to avoid overspending (shows potential savings)
- Autoscaling - Vertical scaling is being handled automatically (click to open autoscaling settings)
Using Container Efficiency Recommendations
On the Scale page for any App Service or Database, the Insights and Recommendations section shows:- Your current Container Efficiency status
- Potential monthly savings (for over-provisioned containers)
- A collapsible recommendation panel with detailed guidance
- The recommended container size and profile
- CPU usage (95th percentile) and peak memory consumption from the last 14 days
- An Autofill Changes button to apply the recommendation to the scaling form
- A View Metrics button to review your service’s metrics
How does Aptible make manual vertical scale right-sizing recommendations?
Here are the key details of how the recommendations are generated:- Aptible looks at the App and Database metrics within the last 14 days
-
There are two primary metrics:
- CPU usage: 95th percentile within the time window
- RAM usage: max RSS value within the time window
-
For specific databases, Aptible will modify the current RAM usage:
- When PostgreSQL, MySQL, MongoDB: make a recommendation based on 30% of max RSS value within the time window
- When Elasticsearch, Influxdb: make a recommendation based on 50% of max RSS value within the time window
-
Then, Aptible finds the most optimial Container Profile and size that fits within the
CPU and RAM usage:
- If the recommended cost savings is less than $150/mo, Aptible won’t offer the recommendation
- If the recommended container size change is a single step down (e.g. downgrade from 4GB to 2GB), Aptible won’t offer the recommendation
Why does Aptible increase the RAM usage for certain databases?
For some databases, the maintainers recommend having greater capacity than what is currently being used. Therefore, Aptible has unique logic that allows those databases to adhere to their recommendations. We have a section specifically about Understanding Memory Utilization where you can learn more. Because Aptible does not have knowledge of how these databases are being used, we have to make best guesses and use the most common use cases to set sane defaults for the databases we offer as well as our right-sizing recommendations.PostgreSQL
We set the manual recommendations to scale based on 30% of the max RSS value within the time window. This means if a PostgreSQL database uses more than 30% of the available memory, Aptible will recommend a scale-up and, conversely, scaling down. We make this recommendation based on setting theshared_buffers to 25% of the
total RAM, which is the recommended starting value:
If you have a dedicated database server with 1GB or more of RAM, a reasonable starting value for shared_buffers is 25% of the memory in your system.Other References:
- https://www.geeksforgeeks.org/postgresql-memory-management/
- https://www.enterprisedb.com/postgres-tutorials/how-tune-postgresql-memory
MySQL
We set the manual recommendations to scale based on 30% of the max RSS value within the time window. We make this recommendation based on setting theinnodb_buffer_pool_size to
50% of the total RAM.
From the MySQL docs:
A larger buffer pool requires less disk I/O to access the same table data more than once. On a dedicated database server, you might set the buffer pool size to 80% of the machine’s physical memory size.
MongoDB
We set the manual recommendations to scale based on 30% of the max RSS value within the time window. We make this recommendation based on the default WiredTiger internal cache set to 50% of total RAM - 1GB:With WiredTiger, MongoDB utilizes both the WiredTiger internal cache and the filesystem cache. The default WiredTiger internal cache size is the larger of either: 50% of (RAM - 1 GB), or 256 MB.
ElasticSearch
We set the manual recommendations to scale based on 50% of the max RSS value within the time window. We make this recommendation based on setting the heap size 50% of total RAM:The standard recommendation is to give 50% of the available memory to Elasticsearch heap, while leaving the other 50% free. It won’t go unused; Lucene will happily gobble up whatever is left over.Other References: